

Chemical stabilization with admixtures of subgrades and base courses can be used to control swelling and frost heave and improve the strength and deformation characteristics of soils. Admixtures such as lime, cement, fly ash, and asphalt are mixed with subgrade soils to reduce swelling and frost heave, and to improve strength, deformation characteristics, and stability. Chemical stabilization is generally performed to a depth of 6 to 12 inches (150 to 300 mm); reaching depths greater than 12 inches (300 mm) generally requires removal and pugmill mixing.
The summaries below are organized by source document, all part of FHWA/SHRP2's “R02/G02: Geotechnical Solutions for Soil Improvement, Rapid Embankment Construction, and Stabilization of Pavement Working Platform” reference series, the same series behind the other technique pages in this library. They're a starting point for understanding the technology and its design logic — not a substitute for a project-specific geotechnical design or a licensed engineer's review.
At a glance
- Basic function: admixtures of lime, cement, fly ash, and/or asphalt control swelling and frost heave and improve the strength and deformation characteristics of subgrades and base courses
- Geologic applicability: lime and cement suit high-plasticity clay soils; fly ash suits soils with little or no plastic fines; asphalt suits silty, sandy, and granular materials; cement kiln dust and lime both suit expansive clays; a high water table in silts and very fine subgrades may cause compaction to pump water to the surface
- Design basis: one FHWA-preferred design document (Terrel et al. 1979), organized around six stabilizer-selection and stabilizer-specific procedures — summarized below as six sub-sections
- QC/QA basis: this technology “lacks formal QC/QA procedures” in the source's own words; 9 individual methods on file are summarized instead, drawn from several different chemical-stabilization references
- Specifications: one genuine FHWA-preferred specification, FP-03 “Section 305 — Treated Aggregate Courses,” summarized in full below
- Cost data: the richest cost-information document in this library so far — a cost-range table plus historical bid data from six different state DOTs, plus a working cost-estimating spreadsheet link
- Complementary / alternate technologies: mechanical stabilization is complementary; alternates include geotextiles and geogrids, mechanical stabilization by mixing aggregate with fine-grained subgrade, dynamic compaction, high-energy impact rollers, rapid impact compaction, and excavation and replacement
- Example applications: Kentucky Route 11 – KY; Washington Dulles International Airport – VA; State Highway 32, Port Washington – WI (full case histories on file for the first two)
Supplementary Graphics
GHRM · Section 17.16.7 · 3 graphics
▼
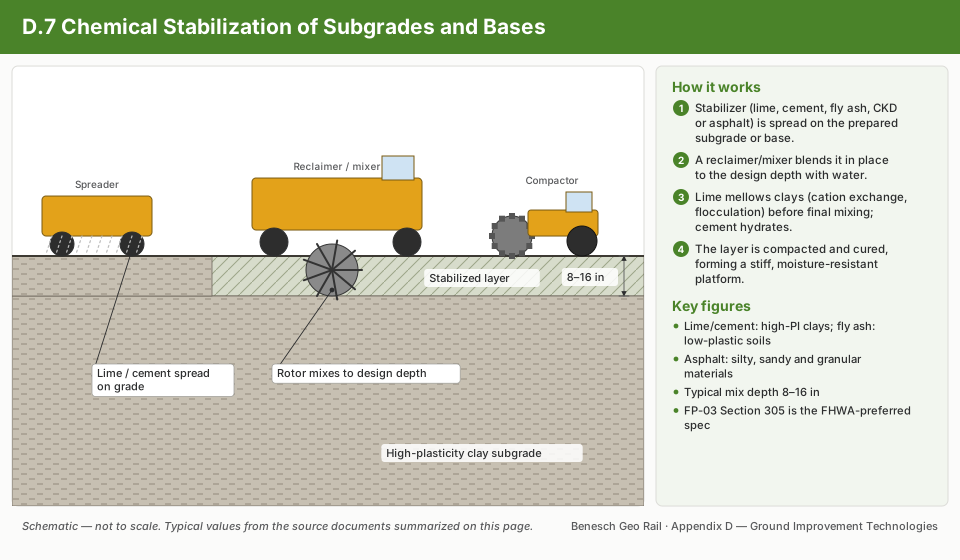
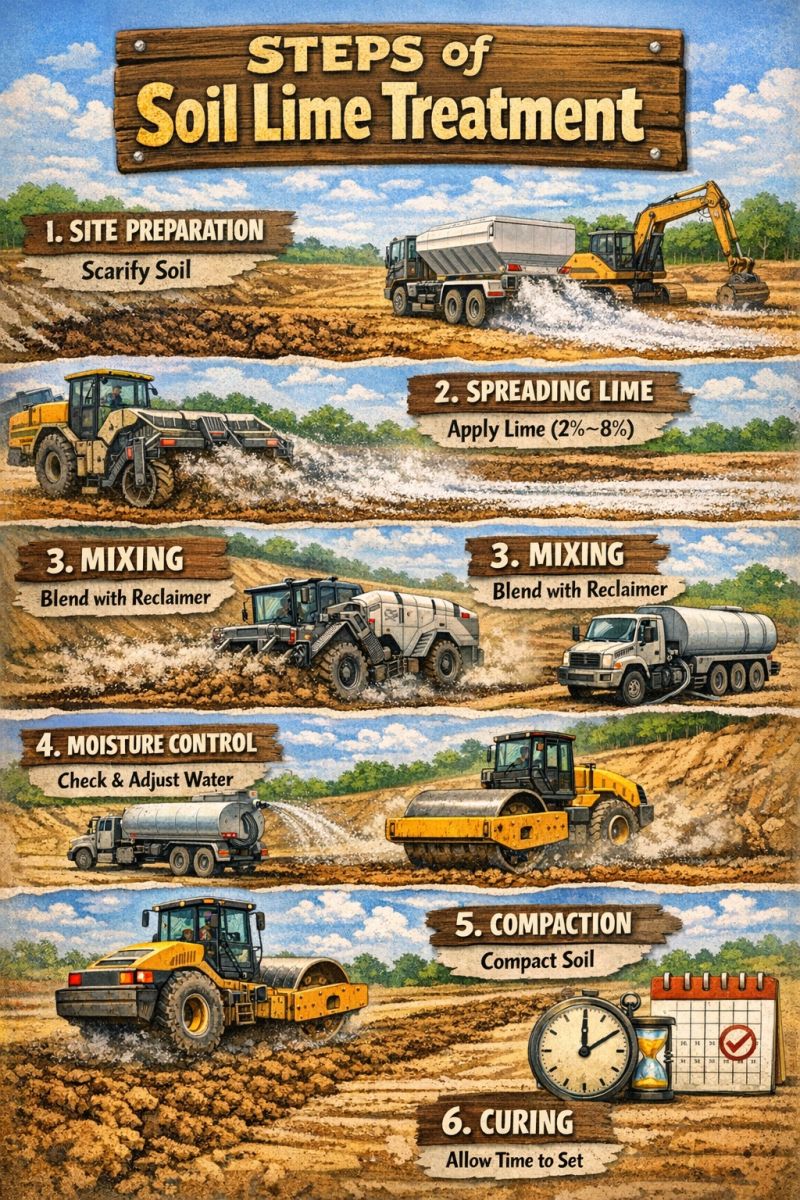
Supplementary graphics for GHRM Section 17.16.7 (Ground Improvement Technologies). The schematic summarizes how the technique works using the typical values documented on this page; the reference infographics are from the Named Graphics library. Click any graphic to enlarge.
Chemical Stabilization of Subgrades and Base Courses — Technology Fact Sheet
GeoTechTools.org · November 2012
▼
Basic function: chemical stabilization with admixtures of subgrades and base courses can be used to control swelling and frost heave and improve the strength and deformation characteristics of soils.
| Advantages | Potential disadvantages |
|---|---|
| Applicable to all soil types | The absence of an allowance for stabilized subgrade support in current pavement design codes |
| Reduces plasticity index, water absorption, swelling potential, and compressibility, and increases strength with time | Dust is produced by some processes in construction |
| Speeds up construction | No long-term performance data |
| Improves durability | |
| Increases stiffness of subgrades and base courses |
Geologic Applicability
Cementing coal fly ash is suitable for cohesive and granular materials. Lime and cement mixtures are applicable to high-plasticity clay soils. Fly ash is suitable for soils that contain little or no plastic fines. Asphalt stabilization is suitable for silty, sandy, and granular materials. Cement Kiln Dust (CKD) stabilization and lime stabilization are applicable to treat expansive clays. A high water table in silts and very fine subgrades may cause compaction operations to pump water to the surface.
General Description
Admixtures such as lime, cement, fly ash, and asphalt are mixed with subgrade soils to reduce swelling and frost heave. Admixtures are also used to improve strength, deformation characteristics, and stability of soils.
Construction Methods
Specific chemicals and methods are recommended for different soil types. Hydrated lime is used to stabilize cohesive soils and granular soils; lime should be considered when the plasticity index of the soil is greater than 12, and can help create a construction working platform. Portland cement is generally used in non-plastic soils. Chemical stabilization is generally performed to a depth of 6 to 12 inches (150 to 300 mm); to stabilize soils to depths greater than 12 inches (300 mm), removal and pugmill mixing is generally required.
Additional Information
Lime reduces the plasticity index and reduces the sensitivity of clay soil to moisture change. Chemical stabilization is marginal in helping New Embankment and Roadway Construction over Unstable Soils. Changing the physical properties of a soil through chemical stabilization may make the soil susceptible to frost heave.
SHRP2 Applications
Embankment and roadway construction over unstable soils; roadway and embankment widening; stabilization of pavement working platforms.
Example Successful Applications
Kentucky Route 11 – KY; Washington Dulles International Airport – VA; State Highway 32, Port Washington, WI.
Complementary Technologies
Mechanical stabilization.
Alternate Technologies
Combination of geotextiles and geogrids, mechanical stabilization through mixing aggregate with fine-grained subgrade, dynamic compaction, high energy impact rollers, rapid impact compaction, and excavation and replacement.
Key references for this fact sheet: Christopher, Schwartz, and Boudreau (2006); Rollings and Rollings (1996).
Chemical Stabilization of Subgrades and Base Courses — Design Guidance
One FHWA-preferred design document, organized into six stabilizer-specific procedures
▼
The Federal Highway Administration (FHWA) has one design document for this technology: Terrel et al. (1979), Soil Stabilization in Pavement Structures: A User's Manual (FHWA-IP-80-2, Vol. I and II), not available for download. Supporting references include ACAA (2008), Army and Air Force (1994), Adaska and Luhr (2004), Christopher et al. (2006), Eades and Grim (1966), Glogowski et al. (1992), Little (1995), National Lime Association (2000), Portland Cement Association (1995), Qubain et al. (2000), Thompson (1970), Transportation Research Board (1987), and Winterkorn and Pamukcu (1990).
The source document organizes its design and analysis procedure into six parts, mirrored below as six sub-sections: (1) Stabilizer Selection, (2) Lime Stabilization, (3) Cement Stabilization, (4) Fly Ash Stabilization, (5) Asphalt Stabilization, and (6) Combination Stabilization.
| Category | Typical items |
|---|---|
| Performance criteria / indicators | Unconfined strength; resilient modulus on stabilized soil; California Bearing Ratio (CBR); R-value; durability (wet/dry, freeze/thaw); Atterberg limits |
| Subsurface conditions | Atterberg limits; sieve analysis; water content; swelling potential; uniformity; groundwater level; sulfate content; organic content; permeability; soil classification |
| Loading conditions | Traffic load; construction load |
| Material characteristics | Type of stabilizer (x-ray diffraction, x-ray fluorescence); percent of stabilizer; strength (compressive and flexure); durability; stiffness; swelling potential; pH |
| Construction techniques | Mixed-in-plant; central plant |
| Geometry | Depth of stabilization; length and area of treatment |
1. Stabilizer Selection▼
The chemical stabilization materials covered are lime, cement, fly ash, and asphalt; proprietary compaction aiders, polymers, and other organic materials are not discussed, due to limited published information and a tendency for many of these materials to be only locally available. Two soil-index-property charts in the source document (Figure 1, “Selection of stabilizers,” and Figure 2, “Suggested stabilizing admixtures suitable for use with soils”) map liquid limit, plasticity index, and gradation combinations to a recommended stabilizer type; both are complex reference charts and are described rather than reproduced here.
In general terms: lime suits plastic, fine-grained clays; cement suits a broad range of granular-to-moderately-plastic soils; fly ash suits soils with little or no plasticity; and asphalt suits granular, silty, and sandy soils with low plasticity.
2. Lime Stabilization▼
Determining lime content is the primary objective of mixture design for lime stabilization. The optimum lime content depends on how the stabilized material will be used and on the soil's constituents; design objectives may involve a reduction in plasticity, construction expediency, or permanent strength/stiffness changes. Mixture preparation, specimen preparation, curing conditions, and testing are the four factors considered in a laboratory testing program. Special testing is required for sulfate-bearing clay to prevent deleterious sulfate-induced heave.
| Type of soil | Untreated | Lime treateda | ||||||||
|---|---|---|---|---|---|---|---|---|---|---|
| Triaxial | CBR | R-value | k-Value | Cohesiometer | Triaxial | CBR | R-value | k-Value | Cohesiometer | |
| Heavy clay | 5.5 | 2 | 20 | 100 | — | 3.2–3.5 | 15–30 | 55–69 | 250–350 | 350–850 |
| Light clay | 4.5 | 5 | 35 | 150 | — | 2.9–3.4 | 20–40 | 60–75 | 300–400 | 450–700 |
| Sandy clay | 3.7 | 12 | 50 | 200 | — | 2.4–3.0 | 35–60 | 65–80 | 400–500 | 550–850 |
| Granular soil, PI = 8+ | 3.2 | 30 | 65 | 250 | — | 1.5–2.7 | 50–75 | 70–80+ | 450+ | 650+ |
| Clay gravel, PI = 6 to 10 | 2.6 | 50 | 75 | 400 | — | 1.0–1.6 | 70–100+ | 80+ | 500+ | 800+ |
Based on use of 4–6 percent lime for clay soils and 2–4 percent for granular and clay-gravel types. Triaxial and cohesiometer values are based on approximately 18 days of laboratory curing, CBR on 4 days curing (soaked), and R-value on about 2 days curing. Stability values of lime-treated specimens increase markedly with longer or accelerated curing.
Because lime stabilization applications are broad, several mix design methods have been developed. According to TRB (1987), these include the California procedure (Terrel et al. 1979), Eades and Grim procedure, Illinois procedure (Terrel et al. 1979), Oklahoma procedure, South Dakota procedure, Texas procedure (AASHTO T-220), Thompson procedure (Thompson 1970), and Virginia procedure (VTM-11).
As an example, the Texas procedure is summarized below:
- Based on the grain size and PI data, the lime percentage is selected from a stabilizer-selection chart (Figure 3 in the source document, a complex reference chart not reproduced here).
- Optimum moisture and maximum dry density of the mixture are determined in accordance with AASHTO T-212 or Tex-113-E.
- Test specimens 6 inches (15.2 cm) in diameter and 8 inches (20.3 cm) in height are compacted at optimum moisture content to maximum dry density.
- All specimens are placed in a triaxial cell and cured as follows: (a) cool to room temperature; (b) dry at a temperature not exceeding 60°C (140°F) for about 6 hours, until one-third of the molding moisture is removed; (c) cool for at least 8 hours; (d) subject specimens to water exposure via capillary action for 10 days (AASHTO T-212).
- The cured specimens are tested in unconfined compression per AASHTO T-212 sections 7 and 8, or Tex-117-E.
The design process flow chart (Figure 4, a complex flow diagram not reproduced here) applies two design criteria — pavement structural behavior and durability requirement — and swell must also be reduced to a satisfactory level for lime-modified soil.
Sulfate Risk Guidelines
| Sulfate risk level | Total soluble sulfate | Guidance |
|---|---|---|
| Too low to be of concern | Below 0.3% (3,000 ppm) | Follow the general construction procedure; low risk of harmful reaction. |
| Moderate risk | 0.3% to 0.5% (3,000–5,000 ppm) | Water content should be 3–5% above optimum for compaction during construction; mellowing period may be extended beyond 72 hours. |
| Moderate to high risk | 0.5% to 0.8% (5,000–8,000 ppm) | Same mix design/construction as the 0.3–0.5% case; laboratory swell-potential testing before treatment is also recommended, to help determine the required mellowing period. |
| High, unacceptable risk | Greater than 0.8% (8,000 ppm) | Treatment requires lime slurry, mixing, mellowing, curing water contents 3–5% above optimum, and mellowing extended beyond 72 hours; a double application of lime may also be used. |
Although long-term stiffness benefits of chemically stabilized soil are not considered in most current U.S. design approaches, Qubain et al. (2000) found that lime-treated subgrade soil can be successfully incorporated into pavement design with economic benefit, using one of three approaches: an effective resilient modulus for the lime-treated subgrade; a conservative CBR of 15 to account for lime stabilization; or treating the lime-stabilized subgrade as a subbase with its own structural layer coefficient. Little information is available in the literature documenting the long-term performance of stabilized soils used as permanent foundation materials.
3. Cement Stabilization▼
For a cement-stabilized system, the general design considerations are compressive strength, durability, and density; if trial mixes must meet a specified durability requirement, a more detailed testing program is needed to determine cement content. According to Christopher et al. (2006), resistance to sulfate attack differs for cement-treated fine-grained versus coarse-grained soil — granular soil-cements are not susceptible to sulfate attack, but cement treatment is not recommended if fine-grained soil has more than 1% sulfate.
| AASHTO soil classification | Unified soil classification | Normal range of cement requirement, % by vol. | % by wt. | Typical cement content for moisture–density test (ASTM D558), % by weight | Typical cement contents for wet–dry (ASTM D559) and freeze–thaw (ASTM D560) tests, % by weight |
|---|---|---|---|---|---|
| A-1-a | GW, GP, GM, SW, SP, SM | 5–7 | 3–5 | 5 | 3–5–7 |
| A-1-b | GM, GP, SM, SP | 7–9 | 5–8 | 6 | 4–6–8 |
| A-2 | GM, GC, SM, SC | 7–10 | 5–9 | 7 | 5–7–9 |
| A-3 | SP | 8–12 | 7–11 | 9 | 7–9–11 |
| A-4 | CL, ML | 8–12 | 7–12 | 10 | 8–10–12 |
| A-5 | ML, MH, CH | 8–12 | 8–13 | 10 | 8–10–12 |
| A-6 | CL, CH | 10–14 | 9–15 | 12 | 10–12–14 |
| A-7 | MH, CH | 10–14 | 10–16 | 13 | 11–13–15 |
Does not include organic or poorly reacting soils; additional cement may be required for severe exposure conditions such as slope protection.
Table 3 in the source document provides a more granular, two-part lookup grid of average cement requirement (percent by weight) for B and C horizon silty and clayey soils, and separately for sandy soils — each cross-referencing an AASHTO group index or sieve-retention percentage against maximum dry density in 5 lb/ft³ bands. It is a large grid (roughly 30 rows across both parts); a representative sample is condensed below rather than the full grid.
| AASHTO group index | Material 0.05–0.005 mm, % | Cement content range across density bands, % by weight |
|---|---|---|
| 0–3 | 0–19 to 60+ | 7–13 |
| 4–7 | 0–19 to 60+ | 7–15 |
| 8–11 | 0–19 to 60+ | 8–17 |
| 12–15 | 0–19 to 60+ | 9–18 |
| 16–20 | 0–19 to 60+ | 10–20 |
For sandy soils, the same source table ranges from about 5% cement (coarse material, low fines, high density) up to about 12% (finer material, more fines passing 0.05 mm, lower density). Consult the source document directly for exact cell-level values before using this table for a specific design.
The short-cut methods developed by the Portland Cement Association are only applicable to sandy soil, in two variants: Method A, for soils not containing material retained on the No. 4 sieve, and Method B, for soils containing material retained on the No. 4 sieve. The design procedure for Method B is summarized below:
- Perform a sieve analysis and determine the bulk specific gravity of the soil.
- Conduct a moisture-density test to determine maximum density and optimum moisture content for a mixture of the soil and Portland cement, per ASTM D 558-57 and AASHTO T 134-57. A source chart (Figure 5) estimates maximum density of the soil-cement mixture; that estimated maximum density, the percentage of material smaller than 0.05 mm, and the percentage retained on the No. 4 sieve are then used with a second source chart (Figure 6) to determine cement content by weight.
- Use the maximum density from step 2 to determine the indicated cement requirement (Figure 6).
- Mold compressive-strength test specimens in triplicate at maximum density and optimum moisture content, using the indicated cement factor from step 3.
- Determine the average compressive strength of the specimens after seven days of moist curing.
- Determine the minimum allowable compressive strength for the soil-cement mixture from a source chart (Figure 7). If the average strength from step 5 equals or exceeds the minimum allowable strength, the indicated cement factor from step 3 is adequate.
Figures 5, 6, and 7 are density/cement-content and minimum-strength nomographs (complex reference charts) and are described here rather than reproduced.
Several approaches control reflective cracking from cement-treated pavement bases, per Adaska and Luhr (2004): increasing density and reducing moisture content during compaction; using a pre-cracking technique (several passes of a vibratory roller over the cement-stabilized base one to two days after compaction, generating hundreds of micro-cracks so a single transverse crack is prevented); or placing a chip-seal, geotextile, or granular layer between the asphalt surface and the stabilized base to relieve stress concentrations from cracks in the treated base.
Source-document inconsistency: the Portland Cement Association reference is cited with four different years across this technique's documents — “PCA (1992)” in this Design Guidance document's own text, “PCA (1978)” and “PCA (1956)” as footnotes on Tables 2 and 3, and “PCA (1980)” in the QC/QA Procedures document — while the bibliography carries only a single Portland Cement Association entry, dated 1995 (Soil-Cement Construction Handbook). This page cites it uniformly as Portland Cement Association (1995), the bibliography's actual entry, rather than silently picking one of the four in-text years.
4. Fly Ash Stabilization▼
Class C fly ash is recommended to stabilize fine-grained plastic soils such as clay, as well as coarse-grained soil. Self-cementing ash hydrates much more rapidly than Portland cement; a 2-hour delay in compaction can decrease maximum density by up to 1.6 kN/m³ (10 pcf) or more, and moisture content also strongly influences compressive strength. To address sulfate-attack risk, fly ash with high sulfate concentrations should be avoided. A laboratory study by Ferguson (1993) recommended a fly ash content of 16% for mixing with subgrade materials to obtain a maximum CBR — this Ferguson (1993) reference is cited only here in the source Design Guidance document and does not appear in this technique's bibliography.
No standard test procedure currently exists for designing materials stabilized with self-cementing ash; an effective procedure can instead be adapted from ASTM C593 (Fly Ash and Other Pozzolans for Use with Lime) and ASTM D1633 (Compressive Strength of Molded Soil-Cement Cylinders):
- Blend soil, fly ash, and water to make a minimum of five test specimens, with moisture contents between 10% below and 6% above the optimum moisture content for maximum density; specimens should have a height-to-diameter ratio of 1.15.
- Compact specimens over a wide range of moisture contents, using a compaction time delay of less than two hours and a 102-mm (4.0-inch) diameter by 117-mm (4.625-inch) high mold (standard or modified Proctor compactive energy); alternatively, 50.8-mm (2-inch) diameter by 50.8-mm high specimens save material and time and yield results close to standard Proctor specimens (Oflaherty et al. 1963).
- Cure test specimens for seven days at 38°C (100°F) per ASTM C593.
- Determine compressive strength of specimens per ASTM D1633.
For higher degrees of stabilization, additional laboratory tests — including freeze-thaw durability via ASTM C593 — may be needed to assess stabilized-material properties for a specific design procedure.
5. Asphalt Stabilization▼
Army and Air Force (1994) provides an equation to estimate the preliminary quantity of cutback asphalt for subgrade stabilization:
| % passing No. 200 sieve | <50% | 60% | 70% | 80% | 90% | 100% |
|---|---|---|---|---|---|---|
| 0 | 6.0 | 6.3 | 6.5 | 6.7 | 7.0 | 7.2 |
| 2 | 6.3 | 6.5 | 6.7 | 7.0 | 7.2 | 7.4 |
| 4 | 6.5 | 6.7 | 7.0 | 7.2 | 7.5 | 7.7 |
| 6 | 6.7 | 7.0 | 7.2 | 7.5 | 7.7 | 7.9 |
| 8 | 7.0 | 7.2 | 7.5 | 7.7 | 7.9 | 8.1 |
| 10 | 7.2 | 7.5 | 7.7 | 7.9 | 8.2 | 8.4 |
| 12 | 7.5 | 7.7 | 7.9 | 8.2 | 8.4 | 8.6 |
| 14 | 7.2 | 7.5 | 7.7 | 7.9 | 8.2 | 8.4 |
| 16 | 7.0 | 7.2 | 7.5 | 7.7 | 7.9 | 8.1 |
| 18 | 6.7 | 7.0 | 7.2 | 7.5 | 7.7 | 7.9 |
| 20 | 6.5 | 6.7 | 7.0 | 7.2 | 7.5 | 7.7 |
| 22 | 6.3 | 6.5 | 6.7 | 7.0 | 7.2 | 7.4 |
| 24 | 6.0 | 6.3 | 6.5 | 6.7 | 7.0 | 7.2 |
| 25 | 6.2 | 6.4 | 6.6 | 6.9 | 7.1 | 7.3 |
The final cutback or emulsified asphalt content must be verified using Marshall Stability Test results. If a bitumen-stabilized soil does not show increased stability at the designed bituminous material content, the soil's gradation should be modified, or a different bituminous material type should be used.
6. Combination Stabilization▼
The use of combination stabilizer materials depends on soil type and stabilizer constituents. A general guideline for selecting stabilizer type and combination appears as Figure 8 in the source document (a complex reference chart, not reproduced here); typically, a combination of stabilizers is recommended when soils have more than 25% passing the No. 200 sieve and a plasticity index greater than 10. The first stabilizer pretreats the soil to alter its properties before the dominant (second) stabilizer is applied, and the second stabilizer's quantity exceeds the first's.
Per Winterkorn and Pamukcu (1990), for lime-fly-ash-and-soil mixtures, lime content varies between 2% and 8%, and fly ash between 8% and 36%; the design ratio of lime to fly ash typically varies from 1:3 to 1:4 for reasons of economy and quality. For cement-fly-ash-and-soil mixtures, the cement-to-fly-ash ratio varies between about 3:7 and 1.5:8.5 for sandy soil, typically around 1:3 or 1:4.
| Category | Agency | Test | Criteria |
|---|---|---|---|
| Strength | ASTM | ASTM C593 unconfined compression, 7-day cure at 100°F (38°C) | Min. 400 psi (2,760 kPa) |
| British Road Research Laboratory | Unconfined compression, 28-day cure | Min. 25 psi (1,720 kPa); except 400–500 psi (2,760–3,450 kPa) for clay soils and severe climatic conditions | |
| California Bearing Ratio | 80% immediately beneath surface, decreasing with depth | ||
| Durability | ASTM | ASTM C593 vacuum saturation method | Min. 400 psi (2,760 kPa) |
| Portland Cement Association | AASHTO T135-70 and T136-70 wet-dry and freeze-thaw brushing tests | 7–14% allowable weight loss, exact value depending on soil grain size | |
| British Road Research Laboratory | Durability ratio (weathered/unweathered strength); Iowa freeze-thaw index of resistance | Min. 80% for both |
Applicable in regions where climatic conditions are a factor in pavement performance.
Design Guidance references cited in this section: Terrel et al. (1979); ACAA (2008); Army and Air Force (1994); Adaska and Luhr (2004); Christopher, Schwartz, and Boudreau (2006); Eades and Grim (1966); Glogowski et al. (1992); Little, D.N. (1995); National Lime Association (2000); Oflaherty, Charles, and Davidson (1963); Portland Cement Association (1995); Qubain, Seksinsky, and Li (2000); Thompson (1970); Transportation Research Board (1987); Winterkorn and Pamukcu (1990). Note on Eades and Grim: the bibliography dates this reference 1966, while the Design Guidance document's own supporting-reference list and body text cite it as “Eades et al. (1969)” — the same year mismatch as the PCA case above; this page uses the bibliography's 1966 date.
Chemical Stabilization of Subgrades and Base Courses — QC/QA Procedures
This technology “lacks formal QC/QA procedures”; 9 individual methods on file are summarized
▼
This technology lacks formal QC/QA procedures, in the source document's own words. Several QC/QA procedures are applied corresponding to different chemical stabilization methods at various stages of construction, to ensure soil properties that provide a reliable working platform and pavement section. Thickness of the stabilized layer, moisture content, stabilizer content, compaction effort and delay, gradation of mixture, shear strength, and elastic properties are all parameters that can be assessed as part of a QC/QA program.
Construction quality is achieved by meeting established requirements detailed in project plans and specifications, including applicable codes and standards. Quality Control (QC) refers to procedures, measurements, and observations used by the contractor to monitor and control construction quality so that all applicable requirements are satisfied; Quality Assurance (QA) refers to measurements and observations by the owner or the owner's engineer to provide assurance that the facility has been constructed in accordance with the plans and specifications.
| Category | Results |
|---|---|
| Existing QC — Material related | Gradation, unit weight, moisture content, plasticity, percent additive, strength, chemical identifier |
| Existing QC — Process control | Percent additive, mixing rate, additive uniformity measurements, curing time |
| Existing QA — Material related | Mix design records; sampling and testing of treated layers for unit weight, moisture content, density and strength |
| Existing QA — Process control | Documented stabilizing agent type and rate of application, mixing adequacy and depth, compactive effort, moisture reasonableness, and compaction compliance results |
| Performance criteria — Material parameters | Unconfined strength with time, resilient modulus on stabilized samples, volume change |
| Performance criteria — System behavior | Proof rolling, FWD, Clegg Impact Hammer, DCP |
| Emerging QC/QA — Material related | Resilient modulus on stabilized samples |
| Emerging QC/QA — Process control | Machine-integrated construction monitoring for compaction, moisture condition and mixing; review of intelligent process equipment records; geophysics for evaluating spatial variability of mix and effective depth |
The entries in Table 1 are a list of typical items, not a list of all methods that could be used for QC/QA on this technology; some QC procedures and measurement items may also serve as QA procedures and measurement items.
QC/QA Guidelines
Prior to stabilizer application: sampling of loose processed materials checks gradation and ensures oversize materials are limited to the specification target value. Cement stabilization typically uses a No. 4 sieve to control pulverization; lime stabilization designates 1-inch and No. 4 sieves. Gradation requirements for fly ash and bitumen-stabilized soil are detailed in Army and Air Force (1994).
During stabilizer application: stabilizer additive content tests are performed transversely across the pavement and at various depths within the stabilized layer, to assess mixing effectiveness. Chemical analysis, the phenolphthalein test, and visual inspection are all used to estimate stabilizer content; chemical analysis is accurate but can be expensive and slow. Per TRB (1987), a phenolphthalein test on a cut face in the stabilized layer is a “quick” test for the presence of lime or cement (a reddish-pink color develops if lime is present), rather than for exact stabilizer content. Trenches are also dug for visual inspection to assure mixture uniformity throughout depth and width; moisture content is measured at various construction stages by oven-dry or nuclear gauge methods, with the hand-squeeze test used informally to assist process control. Field personnel should track the depth of stabilized layers before and after compaction, checked routinely during mixing along with uniformity.
In-situ verification: nuclear gauge testing is common for checking required dry density after compaction. Clegg impact hammer and dynamic cone penetrometer (DCP) tests measure stabilized-subgrade stability at various times after stabilization. Undisturbed samples, after laboratory curing, can be used to determine unconfined compressive strength and resilient modulus in the laboratory.
Phenolphthalein Test▼
Reference(s): Army and Air Force (1994); Austroads (1998); Transportation Research Board (1987). Method summary: phenolphthalein is a color-sensitive indicator sprayed on soil to determine the presence of lime or cement in the field or laboratory; a reddish-pink color develops when a stabilizer is present (pH ≥ 10), verifying stabilizer presence and mixing uniformity.
Accuracy and precision: provides only an estimate of lime and cement content for depth of treatment. Adequacy of coverage: used only for checking soil locally. Implementation requirements: visualizing a reddish-pink color is straightforward, requiring minimal training or experience. General comments: useful for distinguishing properly treated from untreated areas, and helps identify where density-test samples should be taken.
Soil Sampling and Laboratory Testing▼
Method summary: soil samples are collected to conduct classification, index, strength, and modulus testing. Strength and modulus testing on laboratory-compacted samples may yield different properties than field samples, due to differences in stress conditions and soil structure.
| Test | QC or QA |
|---|---|
| Atterberg limits | QC/QA |
| Water content | QC/QA |
| Particle size distribution | QC/QA |
| Proctor | QC/QA |
| Density | QC/QA |
| Organic content | QC |
| Consolidation | QA |
| Shear strength | QA |
| Resilient modulus | QA |
| California Bearing Ratio (CBR) | QA |
Accuracy and precision: depends on the test method; most are widely used and standardized by ASTM and AASHTO. Adequacy of coverage: measures only the sampled soil's properties; experience is required to interpret layering information from multiple borings and samples. Implementation requirements: a drill rig is needed for undisturbed samples from greater depths; shallow undisturbed samples can use hammer-driven Shelby tubes or test pit excavation.
Spot or Overall Check▼
Reference(s): Austroads (1998); Army and Air Force (1994); Little, D.N. (1995); Portland Cement Association (1995); Transportation Research Board (1987). Method summary: checks the stabilizer application rate. A spot check places a tray or mat of known area on the surface and weighs the stabilizer deposited on it after spreading; an overall check verifies the distance or area over which a truckload of stabilizer of known weight is spread.
Accuracy and precision: not documented in the references. Adequacy of coverage: a spot check typically uses a canvas of about 1 m² (1 yd²|); an overall check can cover the distance or area over which a truckload of cement of known weight is spread. Implementation requirements: the ability to weigh the truck before and after application (overall method), or to weigh and measure a canvas (spot check). General comments: field personnel should know the required stabilizer quantity per unit length or area of pavement; spot checking with a canvas of known area, or an overall check against known tonnage, helps assure the proper quantity is applied.
Chemical Analysis▼
Reference(s): Austroads (1998); Qubain, Heirendt, and Li (2006). Method summary: evaluates element and mineralogy constituents of stabilized soil and stabilizer using X-ray fluorescence (XRF) and X-ray diffraction (XRD).
Accuracy and precision: not documented in the references. Adequacy of coverage: only representative samples are tested. Implementation requirements: both XRF and XRD testing require experience and knowledge to conduct. General comments: used for lime, cement, and fly ash content verification for uncured mixture, and for binder content measurement.
Nuclear Gauge Method▼
Reference(s): Austroads (1998); Little, D.N. (1995); Qubain, Heirendt, and Li (2006); Portland Cement Association (1995); Transportation Research Board (1987); White et al. (2005). Method summary: commonly used to determine compacted field density and moisture content of stabilized soil (ASTM D2922, D3017, D6938; AASHTO T238, T239) — a non-destructive test performed in a matter of minutes.
Accuracy and precision: per ASTM D6938, repeatability from a single operator gives a standard deviation of 0.3 to 1.2 lb/ft³ for wet density and 0.3 to 0.5% for moisture content, depending on soil type and test method (direct transmission or back scatter). Adequacy of coverage: commonly taken at several locations at intervals of 150 meters (500 feet) in the field. Implementation requirements: proper operation, calibration, and maintenance are essential; operator training and licensing are required. General comments: used to determine moisture content at the start of and during processing, and to check field density regularly; cannot measure density below 250–300 mm (10–12 inches). Comparing laboratory compaction results with field moisture-density readings helps confirm sufficient compaction.
Visual Inspection▼
Reference(s): Army and Air Force (1994); Portland Cement Association (1995). Method summary: trenches may be dug for visual inspection to evaluate depth and uniformity of mixing; a uniform color along the soil profile usually indicates thorough mixing.
Accuracy and precision: cannot be quantified — qualitative and dependent on inspector experience. Adequacy of coverage: limited to the observed area. Implementation requirements: some experience is necessary to recognize inadequate mixing or lack of stabilizer. General comments: adequate mixing shows a uniform soil color; a streaked appearance indicates non-uniform mixing.
Dynamic Plate Load Tests (LWD, FWD, Clegg Hammer)▼
Reference(s): Qubain, Heirendt, and Li (2006); Vennapusa and White (2009); White et al. (2005). Method summary: Light Weight Deflectometer (LWD), Falling Weight Deflectometer (FWD), and Clegg hammer tests obtain plate deflections under dynamic impulse loading. LWD applies relatively low contact stress (about 0.2 MPa or less) versus FWD (up to 1.0 MPa); FWD is often performed with an array of deflection sensors to develop deflection-basin data assessing subsurface stiffness/modulus to a depth of about 2 meters. The Clegg hammer measures deceleration (g's) under impulse loading (ASTM D5874).
FWD equipment is trailer-mounted; LWD and Clegg hammer devices are enclosed-box units carried by truck. Different manufacturers use different sensor types (geophones, accelerometers, or sensiometers), and device configuration affects the modulus value; LWDs are generally set up with 200 and 300 mm diameter plates, FWDs with 300 and 450 mm plates.
Accuracy and precision: LWD measurement values may vary by device and sensor type, and repeatability varies with the LWD device used. FWD results are widely used in the U.S. for direct measurement of pavement foundation material properties. For the Clegg hammer, ASTM D587 indicates a coefficient of variation of 2% or better in good laboratory workshop conditions; overall accuracy is not documented for any of the three, as there is no standard comparison method. Adequacy of coverage: the number of tests needed depends on observed variability; tests are relatively fast (about 5 minutes or less). LWD and Clegg hammer have shallower measurement depth (≤0.5 m) than FWD (up to about 2 m). Implementation requirements: experience and special equipment are necessary; LWD and Clegg hammer generally require less training and are less expensive than FWD. General comments: provides a direct measure of dynamic elastic modulus and can serve as a QC/QA tool.
Dynamic Cone Penetrometer Test▼
Reference(s): Qubain, Heirendt, and Li (2006). Method summary: DCP tests assess compaction improvement depth by comparing before- and after-stabilization results, generally used in pavement foundation layer QA and able to measure soil properties to about 2 meters. Difficulties include large particles or boulders in the subsurface. Per ASTM D6951, the test drives a cone tip into the soil by lifting an 8 kg sliding hammer to a 575 mm drop height and releasing it; total penetration for a given number of blows is measured and recorded as mm/blow (penetration resistance). ASTM D6951 provides correlations between CBR and DCP results for different soil types; correlations to undrained shear strength and modulus are also documented in the literature.
Accuracy and precision: testing may be difficult in subsurface conditions with large boulders or rocks; ASTM D6951 indicates repeatability standard deviation of less than 2 mm/blow. Adequacy of coverage: sufficient evaluation requires many tests, depending on subsurface variability; penetration tests can assess improvement to greater depths than other surface tests. Implementation requirements: some experience and special equipment are necessary; DCP tests can be performed by one or two people. General comments: empirical correlations relate penetration-test results to soil engineering properties (strength, bearing capacity, stiffness/modulus, liquefaction susceptibility); useful for both QA and for QC assessment of improvement with increasing passes.
Static Plate Load Tests▼
Reference(s): Vennapusa and White (2009). Method summary: Static Plate Load Tests (PLT) obtain load-versus-deflection curves to determine modulus of subgrade reaction, soil elastic modulus, or bearing capacity, by increasing a static load on the soil and recording plate deflections. ASTM D1195-93 describes repetitive static PLTs for airport and highway pavement evaluation and design; AASHTO T-222 describes a non-repetitive static PLT method for soils and flexible pavement components.
Accuracy and precision: widely accepted in geotechnical engineering; ASTM D1195-93 notes that precision could not be determined due to soil variability, and accuracy could not be determined for lack of a reference test. Adequacy of coverage: sufficient evaluation requires many tests; one referenced specification recommends one static PLT over a trial compaction section about 4 by 40 meters. Implementation requirements: experience and special equipment are necessary to produce sufficient reaction force (a heavy truck, dozer, or other heavy equipment is typically used); a trained field engineer is required to analyze load-deflection curves against design assumptions. General comments: provides a direct measure of modulus and/or bearing capacity and can serve as a QA tool for verifying design values.
Note on Portland Cement Association citations in this section: the source QC/QA Procedures document cites “PCA (1980)” throughout; as with the Design Guidance document (see the note there), this page cites the bibliography's single actual Portland Cement Association entry, dated 1995, rather than the in-text 1980 date.
Chemical Stabilization of Subgrades and Base Courses — Specifications
One genuine FHWA-preferred specification: FP-03, “Treated Aggregate Courses”
▼
Review of existing specifications: performance specifications are generally not used for chemical stabilization projects, since no suitable testing methods exist for measuring long-term performance of stabilized pavements immediately after construction. Combined performance-and-method approach specifications are used for most chemical stabilization projects instead; lime-fly-ash methods require additional specification sections. Available specifications for fly ash and lime/fly ash stabilization methods are described as lacking completeness — important sections such as acceptance criteria and minimum contractor qualifications are often missing. Some QC/QA testing methods, such as the Clegg impact hammer and Dynamic Cone Penetrometer (DCP) tests, are not described in the specifications reviewed.
Preferred Specification
The Federal Highway Administration (FHWA) provides a preferred specification for this technology: Standard Specifications for Construction of Roads and Bridges on Federal Highway Projects (2003, FP-03), available for download at flh.fhwa.dot.gov/resources/pse/specs/.
Specification name/number: Section 305, Treated Aggregate Courses (FHWA 2003). This section covers construction of one or more courses of an aggregate-and-cement mixture, or an Aggregate, Fly ash, Lime, and Cement (AFLC) mixture, on a prepared roadbed. It is a combined performance-and-method-approach specification: properties of the aggregate and mixture are measured during construction, and detailed QC/QA programs are included. It is intended as a generic specification for stabilizing/modifying subgrades and base courses, easy to follow and understand. The contractor is responsible for material selection, mix design, and QC/QA per the specification's requirements; the engineer verifies the mix design and conducts quality assurance. The contractor can obtain information on materials, equipment, and construction methods from the specification, though additional information may be needed to bid accurately.
Guideline Specification Outline — Section 305, Treated Aggregate Courses▼
(a) Description. Covers constructing one or more courses of an aggregate-and-cement mixture, or an AFLC mixture, on a prepared roadbed. Treated aggregate courses are designated as cement or AFLC; aggregate grading is designated per Table 703-2.
(b) Material. Aggregate, blotter, chemical admixture (set-retarding), emulsified asphalt, fly ash, hydraulic cement, lime, and water, each conforming to its own subsection of the parent specification.
(c) Construction Requirements. Submit a treated aggregate course mix design 30 days before production. Provide a minimum average compressive strength of 500 psi with no single test below 400 psi (AFLC mixture molded, cured, and tested per ASTM C 593 parts 10 and 11, with the curing period revised from 7 to 28 days at 100±3°F).
| Material | Percent by mass of total dry mix |
|---|---|
| Aggregate | 90–96 |
| Hydraulic cement | 4–10 |
| Material | Percent by mass of total dry mix |
|---|---|
| Aggregate | 75–92 |
| Fly ash | 6–20 |
| Lime and hydraulic cement | 2–5 |
Include with the mix design: source of each component material; results of applicable tests; target values for each specified aggregate sieve size; a 200-pound sample of aggregate; a 50-pound sample of fly ash; a 25-pound sample of lime; a 25-pound sample of hydraulic cement; and a 5-pound sample of the retarder or other admixtures. Begin production only after the mix design is approved; furnish a new mix design if a material source changes.
(d) General. Store chemical additives and admixtures in closed, weatherproof containers. Prepare the underlying surface per Section 204 or 303 as applicable. Determine optimum moisture content per AASHTO T 180, Method D.
(e) Mixing. Do not begin mixing when atmospheric temperature is expected to fall below 40°F within 48 hours; do not place a treated aggregate course on a frozen or muddy surface, or while it is raining or snowing. Mix components until uniform, adding sufficient water for optimum moisture content for compaction plus 2 percent. Equip the mixer with batching or metering devices; maintain amounts within tolerance: aggregate ±2.0% by mass, fly ash ±1.5%, lime or cement ±0.5%, retarder or other additive ±2.0%, water ±2.0%. A retarder may slow initial set up to 2 hours (dissolved in water, added uniformly). When a central plant is used, transport the mixture in vehicles that maintain moisture content and prevent segregation and loss of fines.
(f) Placing, Compacting, and Finishing. Place, compact, and finish per Subsections 301.04, 301.05, and 301.06, maintaining moisture content within ±2 percent of optimum. Do not leave uncompacted treated aggregate undisturbed for more than 30 minutes; complete compaction and finishing within 1 hour of adding water (longer with a retarder). The compacted surface must be smooth, dense, and free of compaction planes, ridges, or loose material. Provide a construction joint if the time between placing adjacent partial widths exceeds 30 minutes.
(g) Construction Joints. For lime and fly ash mixtures, tie each day's operation into the previous day's completed work by remixing about 2 feet of the completed course before processing additional sections, adding 50 percent of the original lime or fly ash amount to the remixed material. For cement mixtures, or when a lime or fly ash mixture remains undisturbed more than 24 hours, cut back into the completed work to form an approximately vertical transverse construction joint.
(h) Curing. No traffic on the treated aggregate course. Keep the completed layer continuously moist (fine, uniform spray under pressure) until the next layer is placed, within 7 days of compacting and finishing. Placement may be deferred up to 21 days by sealing the surface with rapid-setting emulsified asphalt (not on intermediate layers): keep the surface continuously moist for at least 7 days, then apply undiluted CRS-2 or RS-2 emulsified asphalt at 0.25 gal/yd² per Section 409, providing a continuous film; if opened to public traffic, apply blotter per Section 411. If the course loses stability, density, or finish before the next course or acceptance, reprocess, recompact, and add additives as necessary, and reapply the asphalt seal where damaged.
(i) Acceptance. Per Table 302-3 for sampling/testing requirements and acceptance quality characteristic category. Fly ash, lime, cement, and chemical admixtures are evaluated under Subsections 106.02 and 106.03; emulsified asphalt under 106.03 and 702.09. Aggregate gradation's upper/lower specification limits equal the calculated mean of test results plus or minus the allowable deviation (Tables 703-2/703-3), with adjustment rules when the mean exceeds the maximum or falls below the minimum gradation value. Construction of treated aggregate courses is evaluated under Subsections 106.02 and 106.04; surface preparation under Section 204 or 303; emulsified asphalt seal under Section 409; blotter under Section 411.
(j) Measurement. Per Subsection 109.02 and as applicable: square yard width measured horizontally to include the top-of-aggregate width including designed widenings; square yard length measured horizontally along the roadway centerline. Emulsified asphalt measured under Section 409; blotter under Section 411.
(k) Payment. Accepted quantities are paid at the contract price per unit of measurement, adjusted per Subsection 106.05, for the Section 302 pay items listed in the bid schedule; payment is full compensation for the work prescribed in this section (see Subsection 109.05).
Reference: Federal Highway Administration (FHWA) (2003). “Section 305–Treated Aggregate Courses,” Standard Specifications for the Construction of Roads and Bridges on Federal Highway Projects. U.S. Department of Transportation, Washington, D.C.
Chemical Stabilization of Subgrades and Base Courses — Cost Information
The richest cost-information document in this library so far — historical bid data from six state DOTs
▼
Commentary: typical contract pay items and units of measurement for chemical stabilization of subgrades and base courses include subgrade modification (measured by the square yard, for all equipment, labor, and incidentals necessary to mix, compact, and fine-grade a chemically modified subgrade), cement/fly ash/lime (measured by the ton for material costs), and treated base course (measured by the square yard, inclusive of all costs to construct a chemically modified base course). Most equipment needed is common to highway construction activities, so additional mobilization is generally negligible; an exception is an on-site plant used to mix a chemically modified base course, for which mobilization costs run approximately $25,000.
Cost Range Table (2007–2010 data)
| Pay item | Quantity range | Unit | Low unit price | High unit price | Factors which may impact costs |
|---|---|---|---|---|---|
| Subgrade modification | Greater than 10,000 | SY | $2.00 | $5.00 | Typical depths are 6″ to 12″; cost increases with depth. Lime subgrade requires two mixing passes, increasing cost. |
| Portland cement | Greater than 150 | TON | $100 | $150 | Distance from material source to project significantly impacts freight cost. |
| Fly ash | Greater than 350 | TON | $40 | $80 | Distance from material source to project significantly impacts freight cost. |
| Lime | Greater than 150 | TON | $125 | $175 | Distance from material source to project significantly impacts freight cost. |
| Cement stabilized base course | Greater than 10,000 | SY | $7.50 | $15.00 | Typical thickness 4″–8″, cost increases with thickness; sensitive to mixture proportions (Portland cement volume per cubic yard); haul distance and specifications affect aggregate cost. |
Historical Cost Information — A Sample of Actual Project Costs
| Pay item description | Quantity | Unit | Low unit price | High unit price | Average unit price | No. of bids | Bid date | Agency |
|---|---|---|---|---|---|---|---|---|
| (SP) Cementitious stabilized subgrade | 19,453 | SY | $1.90 | $5.71 | $3.85 | 6 | 3/18/2010 | Oklahoma DOT |
| (SP) Fly ash | 840 | TON | $51.25 | $90.00 | $69.05 | 6 | 3/18/2010 | |
| (SP) Cementitious stabilized subgrade | 148,220 | SY | $0.97 | $4.30 | $2.33 | 7 | 6/17/2010 | Oklahoma DOT |
| (SP) Fly ash | 10,139 | TON | $29.25 | $65.00 | $50.46 | 7 | 6/17/2010 | Oklahoma DOT |
| Processing fly ash treated subgrade | 11,496 | SY | $1.70 | $3.50 | $2.18 | 7 | 8/21/2008 | Colorado DOT |
| Fly ash | 470 | TON | $80.00 | $184.00 | $97.09 | 7 | 8/21/2008 | |
| Processing lime treated subgrade (12″) | 143,962 | SY | $1.25 | $3.18 | $2.29 | 6 | 4/29/2010 | |
| Hydrated lime | 3,563 TON | TON | $125.00 | $140.13 | $137.41 | 6 | 4/29/2010 | Colorado DOT |
| Lime treated subgrade | 18,292 | SY | $2.00 | $5.00 | $2.88 | 9 | 3/20/2009 | Arizona DOT |
| Hydrated lime for subgrade treatment | 146 | TON | $170.00 | $290.00 | $219.44 | 9 | 3/20/2009 | |
| Lime Trt Exst Matl (8″) | 126,902 | SY | $0.75 | $3.00 | $1.96 | 10 | 11/4/2010 | Texas DOT |
| Lime (hydrated, slurry) | 3,197.6 | TON | $128.00 | $145.00 | $138.28 | 10 | 11/4/2010 | |
| Cem Trt (Mx Exst Mtl & Nw Bs)(DC)(6″) | 136,876 | SY | $1.00 | $3.00 | $1.88 | 3 | 11/5/2010 | |
| Cement | 1,157 | TON | $110.00 | $154.69 | $133.88 | 3 | 11/5/2010 | Texas DOT |
| Cement stabilized subgrade, 16″ deep (WT:07) | 42,505 | SY | $2.50 | $6.67 | $4.53 | 8 | 3/16/2007 | Ohio DOT |
| Cement (WT:07) | 1,762 | TON | $110.00 | $150.00 | $123.46 | 8 | 3/16/2007 | |
| Manipulation for treated subgrade (cement) | 221,640 | SY | $1.55 | $1.85 | $1.65 | 3 | 4/21/2010 | Kansas DOT |
| Cement | 3,839 | TON | $95.00 | $125.00 | $114.67 | 3 | 4/21/2010 | |
| Cement treated base | 205,244 | SY | $7.90 | $10.00 | $9.12 | 3 | 4/21/2010 | |
| Quality control testing (CTB) | 205,244 | SY | $0.20 | $0.50 | $0.32 | 3 | 4/21/2010 |
This is the richest historical cost dataset in this reference library so far: six different state DOT sources (Oklahoma, Colorado, Arizona, Texas, Ohio, and Kansas), spanning bid dates from March 2007 through November 2010.
Conceptual Cost Estimating Tool
A cost estimating spreadsheet for producing a preliminary project scoping estimate is available at geotechtools.org/documents/cssb_costtool_r1.xlsx. It is intended to develop a preliminary project scoping cost estimate, based on the typical construction cost item values in the Cost Information product or on user-specified cost values when known; users should read and understand the Cost Information product before using the tool.
Kentucky Route 11
Year constructed 1986–1988 · Owner, Contractor, and Engineer not on file
▼
Location: Kentucky Route 11, about 11.7 km (7.3 miles) north of Beattyville, Kentucky. Year constructed: 1986–1988. Owner / Contractor / Engineer: not identified in the source case history.
Project summary/scope: a roughly 9.6 km (6-mile) portion of Route 11 was divided into seven sections — one unstabilized and six chemically stabilized — using four types of chemical subgrade stabilization: Atmospheric Fluidized Bed Combustion (AFBC) byproduct, cement, hydrated lime, and multi-cone kiln dust. This case history focuses on the two sections stabilized with the AFBC byproduct, evaluating its feasibility as a stabilization agent.
Subsurface conditions: inter-bedded shale, sandstone, and coal. Natural soils had liquid limits of 36–43% and plasticity indices of 12–15%; about 70% of particles passed the No. 200 sieve.
Performance: the two AFBC-stabilized sections (1.35 km / 0.84 miles and 1.74 km / 1.1 miles long) were compacted to the dry density specification, with 7% and 10% AFBC byproduct selected for the two sections respectively — chosen at the point where increasing the stabilizer percentage produced no further increase, or only a slight increase, in unconfined compression strength. In-situ CBR values ranged from 34 to 53 seven days after construction, and from 10 to 54 measured periodically from October 1987 to March 1999. Overall, satisfactory performance was achieved over a 12-year period.
Performance monitoring: heave or differential swelling occurred in several places two months after construction of the base courses on the two AFBC-stabilized sections, consisting of primary and secondary swelling. Maximum primary swell ranged from 1.8 to 8.8 cm (0.7 to 3.5 inches); secondary swell was very small over a 5-year period.
Project technical paper: Hopkins, T.C., and Beckham, T.L. (1999). “Long-Term Performance of a Highway Subgrade Stabilized with an Atmospheric Fluidized Bed Combustion Material.” 1999 International Ash Utilization Symposium, Center of Applied Energy Research, University of Kentucky, Kentucky, 1–12.
Date case history prepared: November 2012.
Washington Dulles International Airport
Location: Virginia · Owner, Contractor, Engineer, and Year Constructed not on file
▼
Location: Washington Dulles International Airport, Virginia. Owner / Contractor / Engineer / Year constructed: none of these fields are populated in the source case history — the fullest blank-field case in this reference library so far.
Project summary/scope: as part of the Dulles Development (d2) Program, 3,048 meters (10,000 feet) of runway was reconstructed with Portland cement concrete, with chemical stabilization of the subgrade using cement.
Subsurface conditions: groundwater table varied between 23 and 305 cm (0.75 and 10 feet) below the existing pavement surface. Soaked CBR values for the natural subgrade soils ranged from 0.7 to 36.8.
Portland cement was selected to treat the top 300 mm (12 inches) of the existing subgrade. Mechanical analysis, durability, shrinkage, and unconfined compressive strength tests were conducted to select the optimum cement content, which was ultimately established at 4%.
Performance monitoring: the source case history's own Performance Monitoring paragraph states — verbatim — that “heave or differential swelling occurred in several places two months after construction of base courses on two Atmospheric Fluidized Bed Combustion (AFBC)-stabilized sections,” with the same primary/secondary swell figures (1.8 to 8.8 cm / 0.7 to 3.5 inches primary swell, small secondary swell over 5 years) as the Kentucky Route 11 case history above.
Project technical paper: Syed, I.M., Fuselier, G.K., and Hewitt, M. (2007). “Innovation in Cement Stabilization of Airfield Subgrades.” 2007 FAA Worldwide Airport Technology Transfer Conference, April, Atlantic City, New Jersey, 1–12.
Date case history prepared: November 2012.
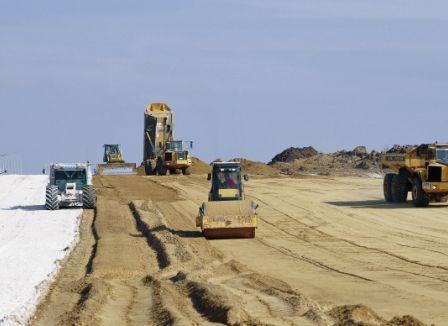
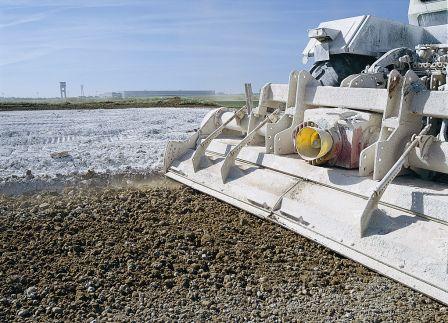
Chemical Stabilization of Subgrades and Base Courses — Photographs
▼
Chemical Stabilization of Subgrades and Base Courses — Bibliography
82 references on file — the largest bibliography in this library so far; 23 cited by name elsewhere on this page are listed in full
▼
The references below were identified and used to complete the technology summaries, assessments, and website documents on file for this technique. A reference matrix follows the reference list in the source document, cross-referencing each reference against topics such as design procedure, construction methods, QA/QC, and case history — as with every other technique page in this library, that matrix extracts from the source PDF as visually mangled, unparseable table fragments and is skipped here.
This is the largest bibliography in the library so far: 82 individual references. Consistent with the established convention for large bibliographies, the 23 references already cited by name elsewhere on this page (in the Design Guidance, QC/QA Procedures, Specifications, Fact Sheet, and Case History sections above) are listed in full below; the remaining 59 are summarized compactly in two groups — 22 state or provincial DOT standard-specification citations, and 36 additional academic and industry references not otherwise named on this page.
References Cited by Name Elsewhere on This Page
- ACAA. (2008). Soil stabilization and pavement recycling with self-cementing coal fly ash. American Coal Ash Association, Aurora, CO. 1–70.
- Adaska, W. S., and Luhr, D. R. (2004). “Control of Reflective Cracking in Cement Stabilized Pavements.” The 5th International RILEM Conference, Cracking in Pavements – Mitigation, Risk Assessment and Prevention, Limoges, France.
- Army and Air Force (1994). Soil Stabilization for Pavements. Joint Departments of the Army, the Navy and Air Force, Washington, DC.
- Austroads (1998). Guide to Stabilisation in Roadworks. National Association of Australian State Road Authorities, Australia.
- Christopher, B.R., Schwartz, C., and Boudreau, R. (2006). Geotechnical Aspects of Pavements. Rep. No. FHWA-NHI-05-037, U.S. Department of Transportation, Federal Highway Administration, Washington D.C.
- Eades, J. L., and Grim, R. E. (1966). A quick test to determine lime requirements for lime stabilization, Highway Research Record 139. HRB, National Research Council, Washington, D.C.
- Federal Highway Administration (FHWA) (2003). “Section 305–Treated Aggregate Courses,” Standard Specifications for the Construction of Roads and Bridges on Federal Highway Projects. U.S. Department of Transportation, Washington, D.C.
- Glogowski, P. E., Kelly, J. M., McLaren, R. J., and Burns, D. L. (1992). Fly Ash Design Manual for Road and Site Application, Volume 1: Dry or Conditioned Placement.
- Hopkins, T. C., and Beckham, T. L. (1999). “Long-Term Performance of a Highway Subgrade Stabilized with an Atmospheric Fluidized Bed Combustion Material.” 1999 International Ash Utilization Symposium, Center of Applied Energy Research, University of Kentucky, Kentucky, 1–12.
- Little, D. N. (1995). Handbook for Stabilization of Pavement Subgrades and Base Courses with Lime. Kendall/Hunt Publishing Company, Dubuque, Iowa.
- National Lime Association (2000). “Guidelines for stabilisation of soils containing sulfates.” Texas, USA.
- Oflaherty, C.A., Charles, E. E., and Davidson, D. T. (1963). The Iowa State Compaction Apparatus: A Small Sample Apparatus for Use in Obtaining Density and Strength Measurements of Soil and Soil-Additives. Project HR-83 of the Iowa State University Board, presented at the Forty Second Annual Meeting of the Highway Research Board, Washington, D.C.
- Portland Cement Association (1995). Soil-Cement Construction Handbook, Skokie, Illinois.
- Qubain, B. S., Seksinsky, E. J., and Li, J. (2000). “Incorporating subgrade lime stabilization into pavement design.” Transportation Research Record, 1721, 3–8.
- Qubain, B. S., Heirendt, K. M., and Li, J. (2006). “Quality Assurance and Quality Control Requirements for Lime and Cement Subgrade Stabilization.” GSP-154: Pavement Mechanics and Performance, Shanghai, China, 229–238.
- Rollings, M. P., and Rollings, R. S. Jr. (1996). Geotechnical Materials in Construction. McGraw-Hill, New York, NY, 249–312.
- Syed, I. M., Fuselier, G. K., and Hewitt, M. (2007). “Innovation in Cement Stabilization of Airfield Subgrades.” 2007 FAA Worldwide Airport Technology Transfer Conference, April, Atlantic City, New Jersey, 1–12.
- Terrel, R. L., Epps, J. A., Barenberg, E. J., Mitchell, J. K., and Thompson, M. R. (1979). Soil Stabilization in Pavement Structures: A User's Manual. FHWA-IP-80-2, Vol. I and II, Department of Transportation, Federal Highway Administration, Washington, D.C.
- Thompson, M. R. (1970). “Suggested Methods of Mixture Design for Lime-Treated Soils.” SPT, American Society for Testing and Materials.
- Transportation Research Board (1987). Lime Stabilization: Reactions, Properties, Design and Construction. State of the Art Report 5, TRB Committee on Lime and Lime-Fly Ash Stabilization, Washington, D.C.
- Vennapusa, P. K., and White, D. J. (2009). “Comparison of Light Weight Deflectometer Measurements for Pavement Foundation Materials.” Geotechnical Testing Journal, Vol. 32(3), West Conshohocken, PA, 239–251.
- White, D. J., Harrington, D., and Thomas, Z. (2005). Final Report — Fly Ash Soil Stabilization for Non-Uniform Subgrade Soils, Vol. I: Engineering Properties and Construction Guidelines. Iowa State University, Iowa.
- Winterkorn, H. F., and Pamukcu, S. (1990). “Soil stabilization and grouting.” Foundation Engineering Handbook, Chapter 9, Ed. by Fang, Hsai-Yang, 2nd Edition, Van Nostrand Reinhold, New York, 317–349.
State and Provincial DOT Standard-Specification Citations (22)
Alabama DOT (2008); Alberta Infrastructure and Transportation (2007); Arkansas DOT (2003); California DOT (2006); City of College Station (2009); Colorado DOT (2005); Delaware DOT (2001); Florida DOT (2010); Georgia DOT (2001); Illinois DOT (2007); Kansas DOT (2007); Louisiana DOT (2006); New Mexico DOT (2007); New York State DOT (2010); North Carolina DOT (2002); Oklahoma DOT (2009); Pennsylvania DOT (2006); South Carolina DOT (2007); Tennessee DOT (2006); Texas DOT (2004); Virginia DOT (2007); Wyoming DOT (2003) — each citing that agency's own standard specifications for lime, cement, fly ash, and/or asphalt stabilized subgrade and base course sections.
Source-document anomaly: the “City of College Station (2009)” entry's own title text reads “City of Tucson and Pima County Standard Specifications for Public Improvements” — the citation label names one municipality while the cited document is titled for two entirely different jurisdictions in a different state. This looks like a citation/document mismatch in the source bibliography itself, reproduced here rather than silently corrected.
Additional References on File (36)
Addison and Polma (2007); Aiban et al. (1998); Air Force Joint Pamphlet (1994); Bhatty et al. (1996); Brazetti and Murphy (2001); Buhler and Cerato (2007); Daniels and Janardhanam (2007); Department of the Army (1992); EPRI (1992); Hong et al. (2006); Hopkins et al. (1988); Hopkins et al. (1995); Hopkins et al. (2002); Huat et al. (2008); Kota et al. (1996); Laguros and Miller (1997); Lee et al. (2007); Little, D.L., Scullion, Kota, and Bhuiyan (1995); Little, D.L. (1996); Parsons, Kneebone, and Milburn (2004); Parsons and Kneebone (2005); Petry and Das (2001); Petry and Little (2002); Rafalko et al. (2007); Sacomaine.org (2000); Senol et al. (2006); Snedker (1996); Solanki et al. (2007); Takallou et al. (1987a); Takallou et al. (1987b); Thompson (1988); AASHTO (2008); Trzebiatowski, Edil, and Benson (2004); Vitton (2008); Voor and Newton (1988); Yesiller et al. (2001); Yusuf et al. (2001).
Note on Little citations: the bibliography carries three distinct “Little” references — Little, D.N. (1995, the Handbook, cited by name above), Little, D.L., Scullion, T., Kota, P.B.V.S., and Bhuiyan, J. (1995, a separate mixture/thickness design guideline), and Little, D.L. (1996, a journal article on lime-stabilized clay subgrades) — a near-duplicate-author-name case similar to prior pilots' Chu- and TerraFusion-citation runs, but here spanning three genuinely different documents rather than one repeated source.
Citation gap: the Design Guidance document's own body text cites “Ferguson (1993)” for a fly-ash-content laboratory study, but no Ferguson reference of any year appears anywhere in this technique's 82-entry bibliography — a reference cited in-text but absent from the reference list, disclosed in the Design Guidance section above rather than silently dropped.