
Geotechnical engineering libraryContact
 benesch
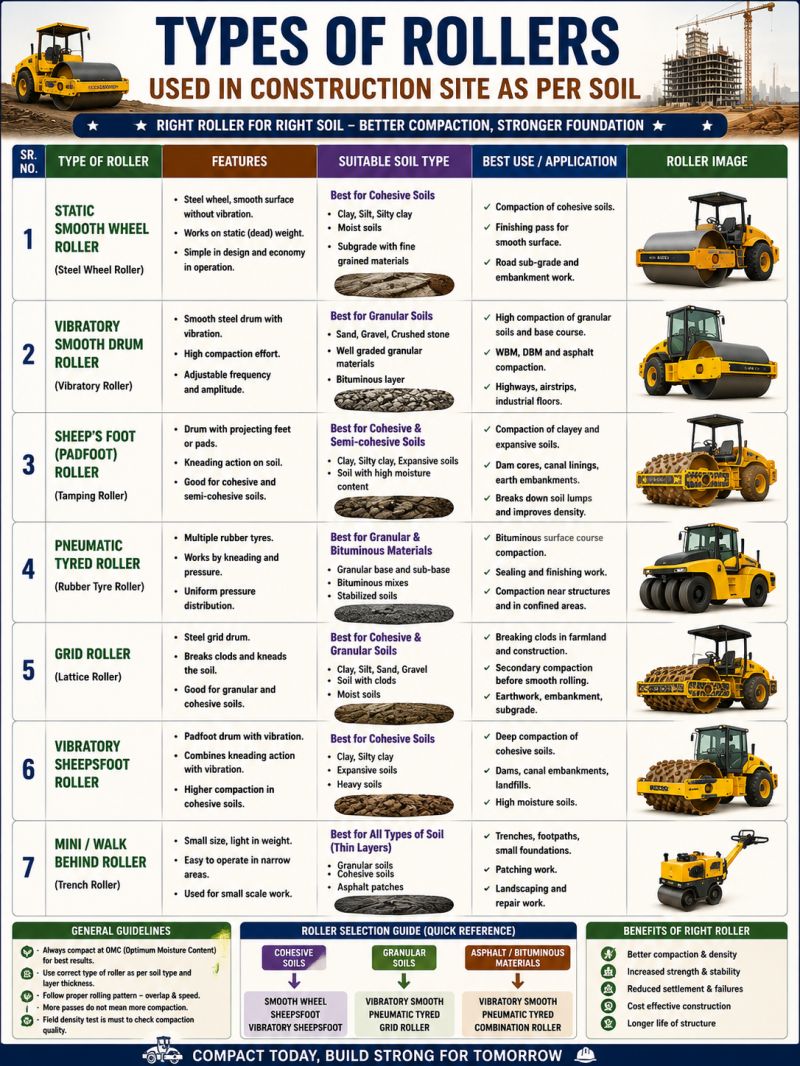
Supplementary graphics for GHRM Section 17.16.28 (Ground Improvement Technologies). The schematic summarizes how the technique works using the typical values documented on this page; the reference infographics are from the Named Graphics library. Click any graphic to enlarge.
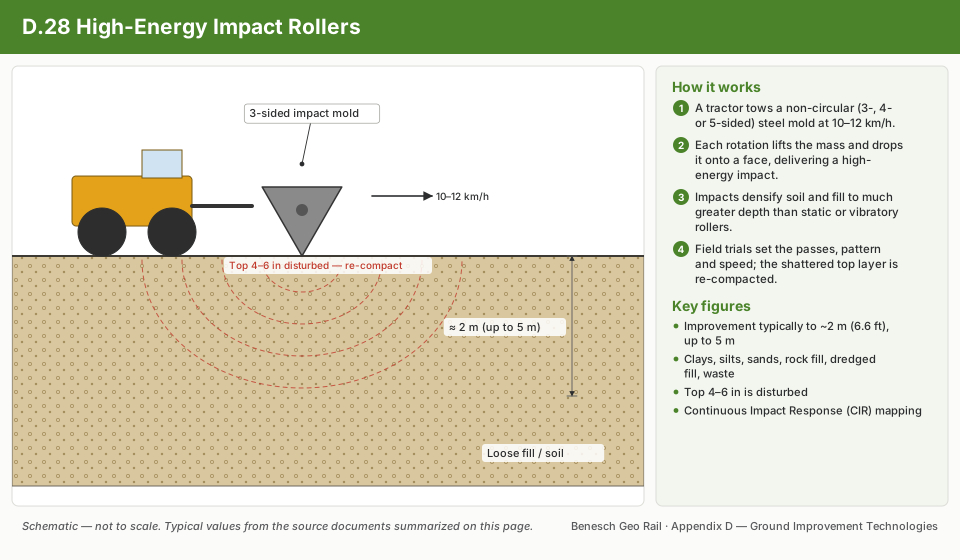
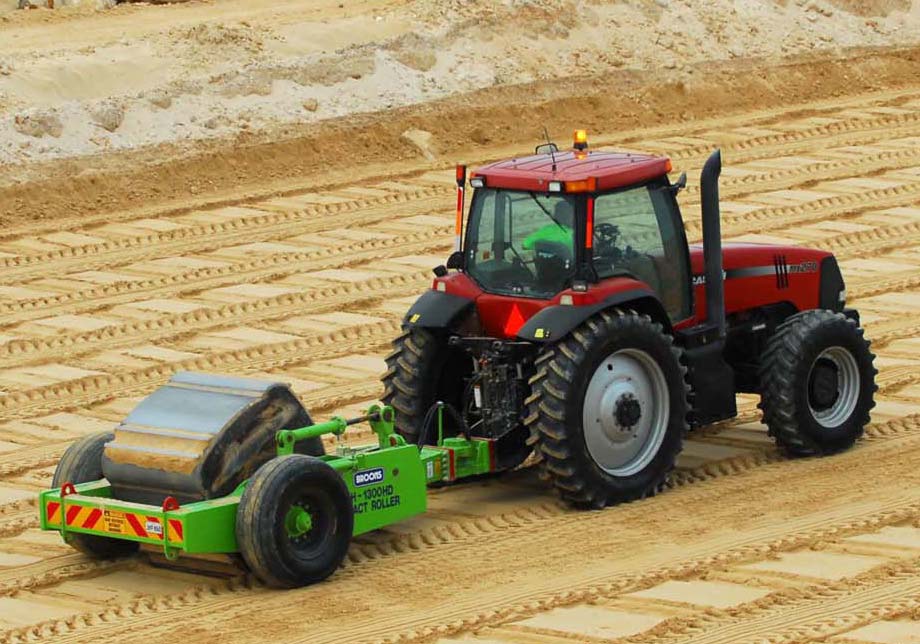
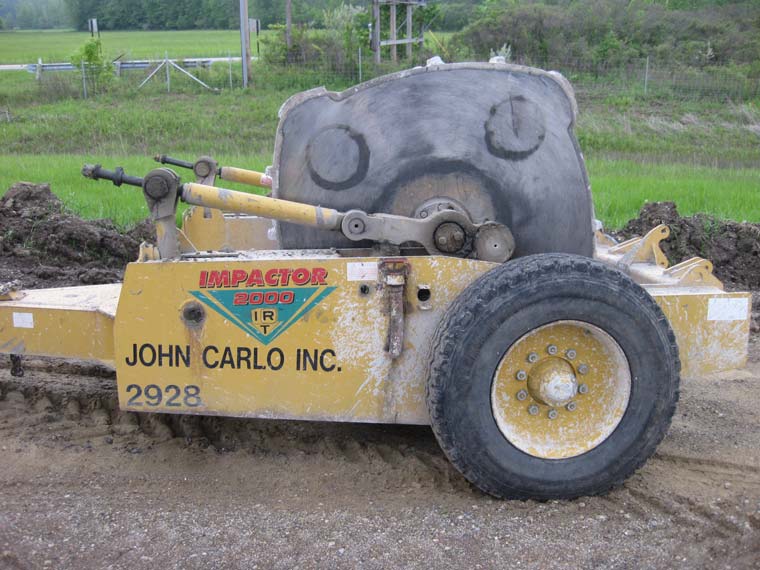
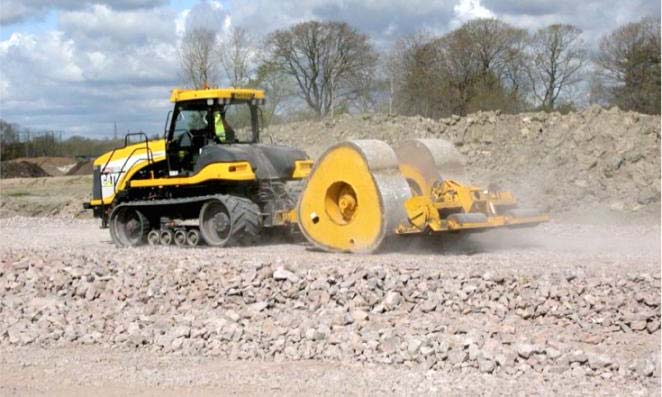
High energy Impact Roller (IR) technology uses a lifting-and-falling motion to compact soil. The roller is pulled at high speeds, 6 to 7.5 mph (10 to 12 km/h), generating a high impact force that densifies materials as it goes. IRs can densify existing fill, collapsible sands, landfill waste, mine haul roads, and bulk earthwork, and can also rubblize existing pavement to create a new subbase.
| Advantages | Potential disadvantages |
|---|---|
| Subgrade can be improved from the surface without overexcavation and replacement | The upper 4 to 6 in (100 to 150 mm) of the surface is disturbed/shattered |
| Can crush rock/concrete into rubble | Small sites with complex geometries limit driving speeds — may not be possible to densify all areas |
| Can compact thick soil lifts, increasing compaction productivity | Vibrations may affect nearby structures |
| Achieves high density | — |
High energy impact roller technology uses non-circular shaped tow-behind solid steel molds.
Impact rollers can densify materials to depths greater than conventional static or vibratory rollers. A recent development is Landpac's Continuous Impact Response (CIR) system, which instruments the IR drum with an accelerometer and continuously monitors decelerations (in g's), integrated with GPS and presented as a real-time map to the operator.
Complementary: intelligent compaction and traditional compaction. Alternates: deep foundations, deep dynamic compaction, stone columns, compaction grouting, excavation and replacement, rapid impact compaction.
IR technology is a construction method used for in-situ soil densification and concrete pavement rubblization. The design procedure should determine the required number of roller passes, the optimal rolling pattern, and the optimal roller travel speed for a specific drum shape and size to achieve the desired soil engineering properties.
Currently, no FHWA document addresses the design procedure. Some references (Pinard 1999, 2001; Kelly 2000; Landpac 2008a) present direct measurement of compaction improvement depth from field compaction trials, which can be used as guidance to determine those parameters. The concept is relatively simple, but the process is subjective to the conditions encountered, variability in subsurface stratigraphy, and spatial variability in material properties. Although IR technology is used on many U.S. pavement-rubblization projects, very limited literature (e.g., Avalle and Grounds 2004) is available on the topic. The current procedure also doesn't address how compaction measurements relate to pavement design; new developments integrating IR with continuous monitoring systems such as CIR have potential to contribute to mechanistic-empirical pavement design.
| Category | Items |
|---|---|
| Performance criteria/indicators | Minimum change in elevation; CPT tip resistance (to a specified depth); DCP tip resistance; stiffness/modulus; unit weight/relative density; groundwater level |
| Subsurface conditions | Stratigraphy; particle size distribution; plasticity; relative density/unit weight; variability; organic content; existing (uncontrolled) fill; old landfill |
| Loading conditions | Traffic loads; embankment loads; structure loads; earthquake acceleration and duration |
| Material characteristics | Unit weight/relative density; water content; particle size distribution; plasticity; shear strength; California Bearing Ratio; compressibility; stiffness/modulus; permeability |
| Construction techniques | Number of passes; number of impacts per minute (travel speed); type of roller drum (solid or wheel type); shape of drum (three-, four-, or five-sided) |
| Geometry | Rolling pattern; improvement depth |
References: Kelly (2000); Landpac (2008a); Pinard (1999, 2001).
The procedure involves selecting a representative test section of the project area and conducting a compaction field trial to obtain critical soil engineering parameters (density, modulus, strength, permeability). The test section is compacted with several roller passes, with field testing performed to obtain soil properties at various intermediate roller passes and compaction improvement depths. The number of IR passes, an optimal rolling pattern, roller travel speed (which relates to number of impacts per minute), and other site-specific construction details (desired moisture content, grading needed for a smooth testing surface, etc.) are determined from the test section and implemented for production operations.
There are no documented case histories where IR technology was used specifically for liquefaction mitigation, but general guidance applies. IR technology may be used at sites with soils susceptible to liquefaction during earthquakes — saturated sands, silty sands, sandy silts, and silts are the likely candidates. Where IR technology supports embankments or structures and reduces settlement, it's also necessary to confirm there's no risk of liquefaction or other ground disturbance that could cause loss of support or lateral spreading.
The initial assessment of whether soil will liquefy in an earthquake compares the in-situ cyclic shear strength (Cyclic Resistance Ratio, CRR) against the cyclic shear stress that would cause liquefaction (Cyclic Stress Ratio, CSR). SPT, CPT, and Becker Penetration Tests (for gravelly/cobbly soils) are used to determine CRR from boundary curves separating liquefaction and no-liquefaction zones on a plot of CSR vs. penetration resistance — the widely used SPT version of this chart is Youd et al.'s (2001) "Liquefaction Resistance of Soils" boundary curve for magnitude 7.5 earthquakes (with permission from ASCE); a similar plot exists for normalized CPT tip resistance. As an example, a saturated clean sand with a corrected blow count (N1)60 of 10 blows/ft and an anticipated cyclic stress ratio of 0.25 will liquefy unless (N1)60 is raised above 22 blows/ft by densification, or the cyclic stress ratio is otherwise reduced.
The analysis is complex in application: CSR depends on input motions within the soil layer (earthquake magnitude/intensity, distance from epicenter, geologic setting, rock conditions, soil profile), CRR depends on overburden stress, fines content, and static shear stress, and normalizing the penetration resistance involves several corrections — especially for SPT. Input ground-motion information can come from local experience, recorded ground motions, or the USGS Ground Motion Calculator and Interactive Deaggregation tool, which help identify the magnitude/distance scenario contributing most to the site's seismic hazard so it can be scaled to the magnitude-7.5 chart correlations. Widely used liquefaction correlation diagrams and computation guidance for SPT and CPT appear in Youd et al. (2001) and Idriss and Boulanger (2008).
The usual design goal is to densify soil sufficiently to attain a factor of safety against liquefaction triggering (CRR/CSR) greater than 1.5, with a minimum of 1.3 — though no single value suits every condition. Each case should be judged on its own merit where a few scattered points fall short of the criteria: a few isolated low values are quite different from several low values grouped closely together, and a large shortfall is more significant than a narrow miss.
Currently, there is no preferred FHWA document that addresses QC/QA procedures or provides guidelines for IR technology. Construction quality is achieved by meeting the requirements detailed in project plans and specifications, including applicable codes and standards. QC refers to procedures, measurements, and observations used by the contractor to monitor and control construction quality; QA refers to measurements and observations by the owner or the owner's engineer to provide assurance that the facility was constructed in accordance with the plans and specifications.
| Topic | Category | Items |
|---|---|---|
| Existing QC/QA procedures & measurement items | QC — Material related / Process control | Moisture/density tests, index properties, elevation monitoring, vibration monitoring; speed, weight, number of passes, rolling pattern |
| QA — Material related / Process control | Penetration tests, static plate load tests, moisture/density tests, index properties, permeability tests, elevation monitoring; visual observation, elevation monitoring, number of passes | |
| Emerging QC/QA procedures & measurement items | Performance criteria — Material parameters / System behavior | Bearing capacity/shear strength, stiffness/modulus; elevation monitoring, uniformity |
| Material related / Process control | Continuous impact response monitoring, intelligent compaction, dynamic plate load tests, geophysical/seismic testing; GPS or laser-based elevation monitoring systems |
Different in-situ spot testing methods have been used, or could potentially be used, for QC/QA on this technology — broadly categorized as: penetration tests, static plate load tests, dynamic plate load tests, moisture/density tests, geophysical/seismic methods, continuous impact response (CIR) mapping, permeability/infiltration rate testing, visual observation, elevation monitoring, and vibration monitoring. With the exception of CIR mapping and some geophysical methods (e.g., ground-penetrating radar), all of these are point measurements requiring many tests to capture soil-property variability, which adds time and construction cost. Some methods have limited applications — penetration tests aren't viable where large rocks are present, and plate load tests may not work on loose sands disturbed by impulse loading. Standardized specifications and guidelines for implementing these technologies alongside IR are not available at this time; application of CIR with IR is not well documented and warrants additional research.
Inspections, construction observations, daily logs, and record keeping are essential QC/QA activities for all technologies — they help ensure good practices and project specifications are followed, catch problems early, keep communication open among all parties, and keep the project on schedule.
Method summary: SPT (ASTM D1586/AASHTO T-206), CPT (ASTM D3441), and Dynamic Cone Penetration (DCP, ASTM D6951) tests assess compaction improvement depth by comparing pre- and post-compaction results. SPT and CPT are widely used and can measure to depths greater than 30 m; DCP is generally used for pavement foundation layers as a QA process and measures to about 2 m. Difficulties arise where large particles or boulders are encountered, which may require drilling to continue testing.
Accuracy/precision: Generally repeatable for comparing before/after values at specified depths, though difficult with large boulders or rocks; DCP repeatability standard deviation is under 2 mm/blow (ASTM D6951); CPT shows about ±10% variation between labs; SPT N-value coefficient of variation is about 100% or more across different equipment/drillers, reducible to about 10% with the same equipment, driller, and energy calibration (Duncan 2000 reports 15–45%). Coverage: Sufficient evaluation requires many tests; penetration tests reach greater depths than surface tests. Landpac (2008b) recommends three DCP tests every 10 passes over a 40×4 m trial section. Implementation: DCP needs one or two people; SPT/CPT require specialized equipment and trained personnel. General comments: Empirical correlations relate results to strength, bearing capacity, stiffness/modulus, and liquefaction susceptibility; useful for both QA and QC (tracking improvement with increasing passes).
Method summary: Load vs. deflection curves determine modulus of subgrade reaction, soil elastic modulus, or bearing capacity, by increasing a static load and recording plate deflections. Avalle and Grounds (2004) used a 320-mm diameter plate; loose surface material needs excavating before testing. ASTM D1195-93 covers repetitive tests (airport/highway pavement design); AASHTO T-222 covers non-repetitive tests.
Accuracy/precision: Widely accepted; ASTM D1195-93 notes precision and accuracy couldn't be determined due to soil variability and lack of a reference test. Coverage: Sufficient evaluation requires many tests; Landpac (2008b) recommends one static PLT over a 40×4 m trial section. Implementation: Needs experience and special equipment (a heavy truck, dozer, or other equipment as reaction force), plus a trained field engineer to interpret load-deflection curves. General comments: Direct measure of modulus/bearing capacity; useful as a QA tool for verifying design values.
Method summary: Light Weight Deflectometer (LWD), Falling Weight Deflectometer (FWD), and Clegg hammer tests measure plate deflections under dynamic impulse loading. LWD applies lower contact stresses (≤ 0.2 MPa) than FWD (up to 1.0 MPa); FWD uses an array of deflection sensors to assess subsurface stiffness/modulus to about 2 m depth. Clegg hammer tests measure hammer decelerations under impulse loading (ASTM D5874). FWD equipment is trailer-mounted; LWD and Clegg devices fit in an enclosed box. Different manufacturers use different sensor types (geophones, accelerometers, sensiometers), which affects modulus values.
Accuracy/precision: LWD values vary by device/sensor type; Clegg hammer has a coefficient of variation around 2% or better in good lab conditions (ASTM D587); no standard reference exists to establish accuracy for any of these methods. Coverage: Fast tests (under 5 minutes each); LWD/Clegg reach shallow depths (≤ 0.5 m) vs. FWD (up to about 2 m). Implementation: Needs experience and special equipment; LWD/Clegg require less training and cost less than FWD. General comments: Direct measure of dynamic elastic modulus; usable as a QC/QA tool.
Method summary: Sand cone (ASTM D1556/AASHTO T191), rubber balloon (ASTM D2167/AASHTO T205), test pit sand/water replacement (ASTM D4914/D5030), nuclear gauges (ASTM D6938/AASHTO T310), and drive cores (ASTM D2937) measure moisture and dry density; results require a reference lab test (Proctor or relative density) to determine in-situ relative compaction. Many of these methods don't work well where large rocks are present.
Accuracy/precision: Precision generally can't be determined for sand cone, rubber balloon, and test-pit methods due to soil variability; ASTM D6938 reports a standard deviation of 0.3–1.2 lb/ft³ for wet density and 0.3–0.5% for moisture content. Coverage: Represents material within about 0.3 m of the test surface; typical earthwork specs require one test per 1,000–10,000 yd³. Implementation: Requires some training; nuclear gauges carry regulatory constraints and require specialized training. General comments: Widely used in earthwork QC/QA, but limited on oversized-particle or variable-fill projects, and doesn't relate easily to strength/stiffness properties used in design.
Method summary: Surface wave testing, cross-hole seismic cones, Ground Penetrating Radar (GPR), and resistivity provide quantitative strength/stiffness information via shear wave velocity data with depth. Use of GPR or resistivity on IR projects specifically is not documented in the literature.
Accuracy/precision: Not documented in the literature. Coverage: GPR can offer better spatial and vertical coverage than conventional seismic methods (cross-hole logging, seismic cones, MASW). Implementation: Requires special equipment, setup, and trained personnel. General comments: Usable for both QC and QA.
Method summary: Compacted soil sampling from borings ("undisturbed" samples) supports laboratory strength and modulus testing; samples from on-site stockpiles support classification, compaction, strength, and modulus testing. Lab-compacted samples can behave differently than field samples due to stress and structure differences, and different lab compaction methods (impact, static, vibratory, gyratory, kneading) yield different properties.
| Test | QC or QA |
|---|---|
| Atterberg limits | QC/QA |
| Water content | QC/QA |
| Particle size distribution | QC/QA |
| Proctor | QC/QA |
| Density | QC/QA |
| Organic content | QC |
| Consolidation | QA |
| Permeability | QA |
| Shear strength | QA |
| Resilient modulus | QA |
| R-value | QA |
| California Bearing Ratio | QA |
| Freeze/thaw susceptibility | QA |
"Undisturbed" samples (Shelby tube) cannot be obtained for granular materials; disturbed samples from stockpiles must be reconstituted in the lab for testing.
Accuracy/precision: Depends on the specific test method; most are widely used and standardized by ASTM/AASHTO. Coverage: Represents only the sample obtained; experience is needed to interpret layering from multiple borings. Implementation: A drill rig is needed for "undisturbed" samples at depth; shallow disturbed samples can use hammer-driven Shelby tubes or test pits. General comments: Enables visual inspection and material for QA testing; helpful when performed before and after compaction.
Method summary: CIR mapping continuously records the deceleration (g's) of the IR drum using accelerometer(s) instrumented in the drum, mapping the results on an on-board computer via GPS. This technology is relatively new and proprietary; limited literature is available (Jumo and Geldenhuys 2004; Landpac 2008a).
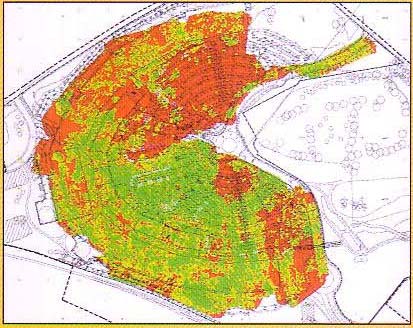
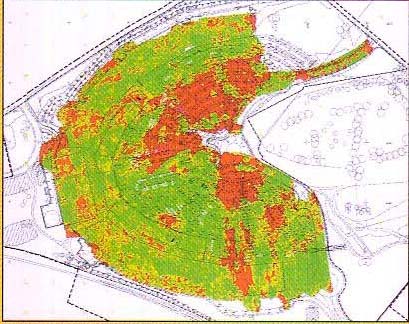
Accuracy/precision: Not yet quantified in the literature; detailed field testing is needed for that assessment. Coverage: Provides nearly 100% spatial coverage. Implementation: Requires specialized equipment and proprietary software. General comments: Effective for QC process control; has potential for QA if site-specific correlations are developed through field trial test sections.
Method summary: Determine coefficient of permeability and infiltration rate, respectively. An in-situ Guelph permeameter (Auzins and Southcott 1999) has monitored permeability change with increasing IR passes; an in-situ double ring infiltrometer (ASTM D5126, Avalle 2004a,b) has monitored infiltration change after IR compaction.
| Testing method | Soil range | Reference |
|---|---|---|
| Infiltrometer test / Double-tube test / Air entry permeameter / Borehole permeameter / Guelph permeameter | Clays and silts (k = 10-2 to 10-8 cm/s) | ASTM D5126 |
| Air permeameter | Clays and silts | Kirkham (1946) |
| Field permeability testing device | Aggregate base/subbase | Moulton and Seals (1979) |
| Field permeameter | Aggregate base/subbase | Clyne et al. (2001) |
| Air permeability testing device | Aggregate base/subbase | White et al. (2007b) |
Accuracy/precision: Difficult to quantify, but can provide a good relative measure of compaction. Coverage: Most tests represent only shallow depths (< 0.5 m). Implementation: Water-based tests are time consuming (hours to days to reach steady state); air/gas-based tests are rapid (e.g., about 30 seconds per test for the White et al. 2007b air permeameter, on granular materials only). General comments: Faster tests suit both QC/QA; slower tests suit QA only.
Method summary: IR can be used as a "proof compactor" or "proof roller" to visually identify soft spots needing additional compaction or rework, typically by monitoring surface depressions or ruts under the roller.
Accuracy/precision: Cannot be quantified. Coverage: Depends on the number of inspectors on site. Implementation: Easy to implement, but needs continuous on-site monitoring. General comments: Widely used for QA on earthwork projects; provides only a qualitative measure — quantitative surface-depression measurement is covered under Elevation Monitoring.
Method summary: Ground elevation change provides a simple and effective means to assess improvement under IR compaction. Selecting test locations is complicated by the rough surface left behind the roller — addressed by lightly trimming the surface with a grader. Elevations can be tracked with string lines and tape, or more advanced options: GPS, robotic total station, laser levels, and LIDAR.
Accuracy/precision: Depends on the method used; laser levels and robotic total stations are accurate and precise, string lines/tape less so. Coverage: Depends on the number of measurement points; roller-mounted GPS gives near-continuous data. Implementation: GPS, robotic total station, and laser levels may require specialized equipment and training. General comments: Can be an effective QC or QA tool.
Method summary: Ground vibrations from IR passes are monitored to assess their influence on nearby building structures, by measuring surface wave velocities at various distances from the impact source and comparing them against local specification limits.
Accuracy/precision: Not discussed in the references reviewed. Coverage: Depends on the number of sensors used. Implementation: Requires specialized equipment and trained personnel. General comments: Used only as a QC measure to mitigate disturbance to nearby structures — it does not measure the compacted soil itself.
There are two existing specifications for IR technology: one developed by the Utah Department of Transportation as a special provision for subgrade improvements, and one developed by IR manufacturer Landpac (South Africa). Both have useful information but are valid only for certain field conditions, with their own limitations and advantages — the Utah DOT specification is written specifically for densifying soils with collapse potential, and the Landpac specification doesn't provide clear QC/QA performance requirements. There is a need to develop a guide specification that accounts for different field conditions and can accommodate different QC/QA methods.
| Specification | Type | Performance level |
|---|---|---|
| Special Provision for Subgrade Improvements (Utah DOT) | Combined performance/method approach | 4 — design-related properties measured during construction (e.g., density and water content per lift) |
| Typical Specification (Landpac) | Performance approach | 2/3/4 — performance-related and design properties measured at end of/during construction |
Performance levels, low to high: 1 – actual performance measured after construction (e.g., settlement at a specific time; may include warranty provisions); 2 – performance-related properties measured at end of construction (e.g., CPT, vane shear); 3 – design properties measured during construction (e.g., modulus per lift); 4 – design-related properties measured during construction (e.g., density and water content per lift).
The Utah DOT specification is a good starting point and can be improved and customized to field conditions by adapting performance-approach QC/QA procedures (CIR, plate load test, DCP, etc.) from the Landpac specification. Dynamic plate load tests (e.g., falling weight deflectometers, which give a rapid dynamic soil modulus measurement) and geophysical methods should also be explored. CIR — a continuous measure of deceleration under the drum's impact — can serve as a valuable QC/QA tool, though its limitations and advantages should be further explored.
1. General — Section Included: requirements for improving soils with low density and collapse potential, as an alternative to (or combined with) over-excavation and replacement. Since the maximum effective improvement depth under IR is about 3 ft, for a 5-ft treatment zone the upper 2 ft is undercut, the remaining 3 ft is improved by impact roller dynamic compaction (IRDC), and the upper 2 ft is replaced with on-site or imported soils meeting the embankment criteria (Section 02056M).
1.2 Related sections: Section 02056M — Embankment, Borrow, and Backfill; Section 02316M — Roadway Excavation. 1.3 Definitions: IRDC — a process where a large square weight with rounded edges is rolled along the ground surface, imparting compactive energy each time an edge strikes the ground; improvement depth depends on tonnage, number of passes, prewetting, and material characteristics.
1.4 Submittals: a detailed safety program submitted before work starts, covering protection of personnel, adjacent structures, and equipment maintenance; an IRDC construction schedule plan 30 days before mobilization; surveyed Record Drawings (stamped by a licensed Utah surveyor) with each payment request; and, if the Contractor elects to use calibration test pads, a test pad plan submitted 15 days before mobilization (UDOT approves or denies the calibrated pass count within three business days).
1.5 Measurement & payment: by the square yard of IRDC coverage, regardless of the number of passes; payment includes tools, equipment, labor, and materials to complete IRDC within the lateral limits shown on the drawings. 1.6 Qualifications: the IRDC Contractor must demonstrate prior experience with an impact roller for dynamic compaction and be pre-qualified, documenting at least one prior project over 50,000 SY successfully densified by dynamic compaction using impact rollers.
1.7 Quality: the Contractor performs quality control during IRDC, including density measurements between 1 and 3 ft using nuclear density test methods — one test per depth (1, 2, and 3 ft) every 5,000 SF, from dug test pits or trenches. Quality assurance: the Geotechnical Engineer documents subgrade wetting (if required), number of passes per area, and speed during dynamic compaction. A Contractor-elected calibration test pad option allows no fewer than three test pads (≥ 1,000 SF each) in different treatment-area locations, with nuclear density testing before and after compaction between 1 and 3 ft.
1.8 Protection of persons & adjacent properties: a detailed safety program verifies protection of on- and off-site personnel and structures, including a Structure Monitoring Program; a maintenance program with daily/weekly/monthly tasks. A Utilities Monitoring Program requires a qualified specialist to detail vibration monitoring before, during, and after compaction for all structures within 100 ft, coordinate with utility owners on allowable vibration limits, and ensure IRDC vibrations don't exceed those limits.
Part 2 — Products: the equipment must provide at least 33,000 pound-feet of energy. Import soil, if needed, follows Sections 02056M and 02316M. Part 3 — Execution: coordinate IRDC scheduling with other contract work; protect survey control points, benchmarks, monitoring wells, and existing structures; identify and protect utilities; finish clearing/grubbing before starting; review drawings for IRDC limits; determine existing grade elevation with the Project Surveyor and perform a post-excavation survey. IRDC provides effective compaction to depths up to 3 ft; over-excavation/re-compaction can supplement it for deeper treatment. A schedule table specifies station ranges, minimum treatment depth (5 ft in all three ranges on this project), and minimum treatment elevations. Treatment extends from the outside edge of existing pavement to 5 ft beyond the toe of the proposed slope (not exceeding 1 ft within the right-of-way). A minimum of 22 passes at the manufacturer's recommended speed densifies the underlying soils; the Contractor keeps daily records (location, pass count, operation rate) and provides dust control.
3.3 Test pad: the Contractor may construct test pads to calibrate the number of passes needed to improve in-situ soils to a dry unit weight of 100 pcf; the calibrated pass count may replace the 30-pass default (Article 3.2) with UDOT and the geotechnical engineer's acceptance. 3.4 Water handling: means must be provided to remove surface water accumulating in excavations. 3.5 Tolerance & survey control: the Contractor provides survey services to maintain both the lateral limits for IRDC and the roadway alignment, recording IRDC lateral limits as Record Drawings updated with each payment request.
1.0 Scope: a Particular Specification covering in-situ treatment of soil by impact compaction. 2.0 Impact compaction plant: a 25 kJ, dual-drum, three-sided impact compactor is used, with compactor energy rating calculated as mass of the rotating drums × lift × the gravitational constant; the compactor is towed by a 4-wheel-drive tractor of at least 200 kW, capable of maintaining 10–12 km/hr towing speed on up to a 5% uphill grade. 3.0 Definition of an impact compactor pass: for the dual-drum 25kJ, 3-sided compactor, a pass is two runs over a 4 m wide lane, where one drum's second run travels the middle of the inter-drum space created by the first run; overlapping drum paths within one pass is not permitted. 4.0 Setting out: the treatment area is defined on the drawings, with setting-out markers controlling operations to ensure every area receives the specified number of passes.
5.0 Preparation & maintenance of compacting surface: compaction proceeds as soon as possible after clearing/grubbing to exploit available in-situ moisture; water is applied as needed to prevent surface crumbling, aid compaction, and control dust; the surface is lightly graded (a grader unit fitted to the roller, or a separate grader pass) to maintain an even operating surface and prevent deep footprints.
6.0 Impact compaction trials: before full-scale work, trials are run on a representative ≥ 40 m long, 4 m wide section (with turning circles outside the trial area) to determine the number of passes needed and confirm the Contractor's plant/methodology. A trial testing table specifies test type, count, and which pass number(s) each test runs at: settlement (20 m length at 1 m intervals, every 5 passes); DCP at three chainages (2 m DCP length, every 10 passes); density testing (0–900 mm at three chainages, at passes 0, 20, and 60); one plate load test (at pass 40); Continuous Impact Response (every 10 passes); maximum dry density/optimum moisture (4 tests, at pass 60); one foundation indicator and one soaked CBR (at pass 60). The target compaction state is based on the number of passes at which soil substantially attains a near-elastic condition, with target coverage determined from settlement results and submitted to the Engineer for approval within one working day; a trial report is compiled after all lab results are received.
7.0 Compaction: impact compaction must be completed before services, drainage pipes, or culverts are installed, under adequate Contractor supervision. Thirty passes are used for tender purposes; if more or fewer passes are ordered, the Contractor's compensation is adjusted accordingly. Vibration monitoring is required where structures lie within a 20 m radius, keeping Peak Particle Velocity below 25 mm/s (a cut-off trench, if needed to mitigate vibration, is paid separately). A daily Compaction Record Book documents the date, area/section, lane, pass-count range for that day, area dimensions, and area×passes compacted, submitted to the Engineer daily for verification.
8.0 Quality control procedure: (1) CIR measurements monitor and record rotating-drum deceleration correlated to GPS position, recorded during the first three passes and the last three passes, presented to the Engineer as raw data (date, time, Y, X, and G/deceleration) and as a triangulated AutoCAD/Modelmaker model with calculation/interpretation of relatively weak areas. (2) DCP tests (2 m depth, 25 m grid, method TMH 6:1984 ST6) run before and after compaction, with additional testing in relatively weak areas flagged by CIR. (3) Relative density testing (TMH1:A10, moisture correction TMH1:A17) on a 50 m grid at 0–300 mm and 300–600 mm depths, with sufficient modified AASHTO dry density samples to determine relative density. (4) Soaked CBR samples (TMH 1) taken in relatively weak CIR-flagged areas. (5) Plate load tests: a 450 mm diameter rigid circular plate loaded in stress increments (0, 45.4, 0, 45.4, 90.9, 136.3, 181.8, 227.2, 272.7, 318.1, 363.5, 409.0, 454.4, 0 kPa), with settlement recorded at 30 s, 1, 2, 4, 8, and 16 min; done 400 mm below natural ground under soaked conditions (12-hour soak minimum), one per 750 m² compacted. (6) A project report details all test results from compaction operations.
9.0 Measurement & payment: Item 9.1, establishment and de-establishment of impact compaction equipment, personnel, and ancillary equipment — measured as a lump sum, payable on completion of impact compaction operations.
Quantifying the cost of compaction using high energy impact rollers is difficult. In simplest terms, the capital investment plus depreciation and maintenance costs must be pro-rated over a given amount of embankment compaction. Availability of high energy impact rollers in the U.S. is limited at this time, so a one-time trial investment in the additional fixed cost is typically not feasible — but spread over a number of projects, a capital investment in compaction equipment that improves productivity may yield significant cost savings per cubic yard. In the long run, high energy impact rollers may save an agency money if compaction specifications can be met with an optimum number of roller passes; implementation on highway projects will likely be driven by new specifications and potential cost savings.
No cost guidance or estimating tool is provided for this technology. Agencies should consult with experienced grading contractors and equipment suppliers to evaluate feasibility and cost for specific projects.
Reconstruction of the Trans Kalahari Highway between Jwaneng and Sekoma, in the Republic of Botswana, in the 1990s. The original road, built in the late 1980s and designed for a 10-year life, showed signs of distress about 5 years after construction. Investigation found the existing bitumen-surfaced road had failed because of an unconsolidated sand subgrade. Impact compaction was specified during rehabilitation design to resolve the weak-subgrade problem, envisioned as a comparatively cheaper fix than excavating and replacing the subgrade conventionally.
Bitumen surface underlain by sand subgrade.
A trial section established the minimum number of passes required (20), based on relationships between number of passes and settlement, density, and DCP shear strength values. During construction, the optimum number of passes was determined based on Continuous Impact Response (CIR) mapping during production work. A Landpac 25-kJ IR equipped with CIR integrated with GPS was used for compaction.
Settlement monitoring, CIR deceleration (g) recording, in-situ densities (nuclear gauge and sand cone), DCP, and Falling Weight Deflectometer (FWD) tests were used. Settlement on the trial section showed a high rate (7 mm per pass) through five passes, a fairly constant rate (3 mm per pass) between 5 and 25 passes, and a low rate (1.8 mm per pass) between 30 and 40 passes. The trial section showed it possible to compact 300–600 mm subgrade sand to 96–98% modified Proctor density, and 600–900 mm subgrade sand to 94–96% modified AASHTO density, with a minimum of 10 passes. CIR values increased about 0.18 g per pass from 1 to 20 passes, and about 0.03 g per pass from 20 to 40 passes. DCP tests showed a significant shear-strength increase between 800 and 1,900 mm depth within the first 10 passes, with no marked increase after 20 passes.
Project technical paper: Jumo, I. and Geldenhuys, J. (2004). “Impact compaction of subgrades – experience on the Trans-Kalahari Highway including continuous impact response (CIR) as a method of quality control.” 8th Conference on Asphalt Pavements for Southern Africa, 12–16 September 2004, Sun City, South Africa.
The airport consists of two parallel runways, 80 terminal gates, and capacity for 50 million passengers and 2 million tons of cargo per year (Phase I completed 2008). The 22 km² project involved 65 million m³ of sand and rockfill reclaimed from the sea at a production rate of 3 million m³ per month. After compaction trials with several techniques (heavy dynamic compaction, conventional vibratory roller compaction, and high energy IR compaction with Broons BH-1300 and BH-1300 HD rollers), high energy impact rolling was chosen as the better alternative; the compaction process was optimized using a Six Sigma quality-improvement scheme.
Dredged sand and rockfill over seabed; the sand fill was calcareous, often shelly, and thus extremely crushable.
Compaction used nine IRs — six with 8-ton modules and three with 12-ton modules — driven in fixed patterns, reversing direction from clockwise to counter-clockwise every ten passes. Process parameters: roller operation speed 10–12 km/hr; impact rate 1.8–2.2 impacts/second; roller track width 2.4–2.8 m per track; watering sessions timed 15–25 minutes each.
Fill compaction requirements: cone penetration resistance of at least 9 MPa below mean sea level, never reducing with depth; in-situ dry density at least 95% of maximum dry density above mean sea level; maximum settlement of 25 mm at a design bearing pressure of 150 kPa. The Six Sigma campaign increased average in-situ dry density by 8% and decreased the variance by 56%.
Project technical paper: Avsar, S., Bakker, M., Bartholomeeusen, G., and Vanmechelen, J. (2006). “Six sigma quality improvement of compaction at the new Doha international airport project.” Terra et Aqua, No. 103, June, pp. 14–22.
The source document also includes a chart (Clegg and Berrangé 1971) comparing surface settlement and dry-density increase with number of passes for impact, pneumatic, single-drum, and double-drum rollers on "collapsing" sand test strips — showing the impact roller achieving both greater settlement and a deeper zone of increased density than the other roller types over the same number of passes.
The full reference list runs to about 38 citations; the most heavily used across the fact sheet, design guidance, QC/QA, and specification summaries above are:
Additional authors represented in the full bibliography include Africon (1997), Auzins & Southcott, Avalle (multiple papers 2004a–2007b), Avalle & Carter, Avalle & McKenzie, Avalle & Young, Bouazza & Avalle (2006a,b), Broons (2009), Burgess & Joubert, Clifford (1978), CSIRO (2000), Davies/Mattes/Avalle, Duncan (2000), Gui et al., Hillman/Tan/Mocke, Kirkham (1946), Landpac (2008c), Moulton & Seals, Scott & Suto, Vennapusa & White, and White et al. (multiple papers) — see the source PDF for the complete ~38-entry list.
The full document also includes a reference matrix cross-indexing each citation against the topics it addresses (technology overview, site characterization, analysis techniques, design procedure/codes, construction methods/time/loads/specs, equipment/contractors, contracting, QA/QC, performance criteria, monitoring, material properties, geotechnical & non-geotechnical limitations, environmental impacts, case history, initial & life-cycle costs, durability, reliability) — see the source PDF for the full matrix.