
NANCY Walkthrough
A step-by-step script for running a ground hazard assessment in NANCY, from site boundary to finished report. Every screenshot comes from the live tool at dirtbert.com/NANCY, worked on one example site from start to finish.
- 1Project definition · network, owner, purpose
- 2Site boundary · KMZ, GeoJSON, shapefile, draw or lat/long
- 3Geospatial data · one click pulls the public record
- 4Field verification · what the ground shows today
- 5Risk score · Rc, class and Level of Service
- 6Alternatives · fixes, costs, residual risk Rr
- 7Report · letter, site sheet, matrix, action plan
How to use this script
Each step is laid out the same way, so you can use it to train someone at a desk, record a narrated video, or follow along on your own.
| Block | What it is for |
|---|---|
| Narration | The words to say out loud if you are presenting or recording. Read them as written. |
| Do this | The clicks and entries, in order, using the exact labels on screen (shown like Pull data for this boundary). |
| Screenshot | The live screen. Gold numbered pins match the numbered key under each picture. |
| Reading the result | What the numbers mean and what to check before moving on. |
| Tip / Watch out | Shortcuts, and the mistakes that cost people time. |
What you need
- Any modern browser on a computer, tablet or phone. Nothing to install and no sign-in.
- A site boundary: a Google Earth KMZ/KML, a GeoJSON, a zipped shapefile, a CSV of lat,lon vertices, or just a latitude and longitude.
- For Step 4, a site visit, or at least a hi-rail or drive-by. Without one, the score stays provisional.
- For costs and the consequence side of the risk matrix: traffic (MGT or AADT), speed, trains per day, and a rough outage cost per day.
Press Load example in Step 2 and you get the same hypothetical Haw River boundary used throughout this script. It is the fastest way to learn NANCY without a real project in hand.
Getting into NANCY
The landing page, the one-time Use and Disclaimers memorandum, and how the assessment page is laid out.
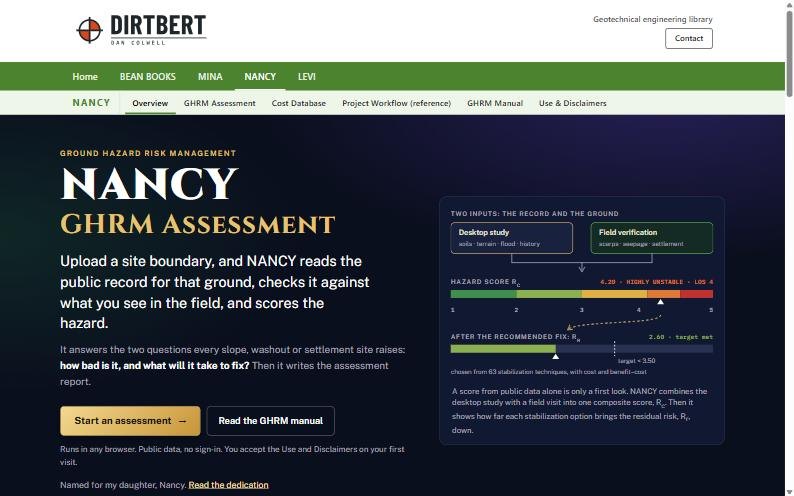
NANCY answers two questions for any slope, washout or settlement site: how bad is it, and what will it take to fix? It reads the public record for the ground, checks it against what you see in the field, scores the hazard, and writes the report.
The landing page
- Go to dirtbert.com and choose NANCY in the green menu bar.
- Press Start an assessment →.
 1
2
3
- 1NANCY menu: Overview, GHRM Assessment, Cost Database, Workflow, GHRM Manual, Use & Disclaimers.
- 2Start an assessment opens the seven-step tool.
- 3The idea in one picture: desktop study plus field visit gives Rc; the fix brings it down to Rr.
Accept the Use and Disclaimers (first visit only)
Every NANCY page checks that you have accepted the memorandum. If you have not, it sends you there first and brings you back afterwards.
- Read the memorandum. Sections cover intended users, licensed review, no warranty, field safety and independence.
- Tick I have read, understand and accept the Use and Disclaimers.
- Press Accept and continue. NANCY takes you to the page you were heading for.
 1
2
3
This browser has already accepted, so the button reads "Continue to NANCY".
- 1Acceptance checkbox.
- 2Accept and continue (Continue to NANCY once accepted).
- 3Withdraw acceptance resets it for this browser.
- Acceptance is remembered in this browser. A new browser, a private window or cleared site data asks again.
- When the memorandum changes, everyone is asked to accept the new version.
How the assessment page is laid out
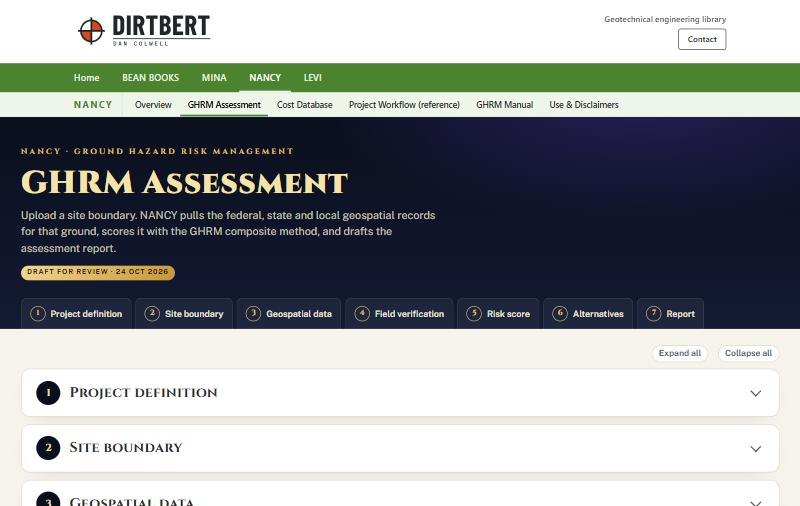
The seven steps run down one page as cards that open and close. The tiles in the dark header jump to any step, and they fill in gold as each step is completed.
 1
2
3
- 1Step tiles: click one to open that step and scroll to it.
- 2Expand all / Collapse all.
- 3Each step card opens with a click on its header.
Project definition
Who owns the line, what the job is, and why you are assessing it. These fields feed the report cover, the transmittal letter and the site sheet.
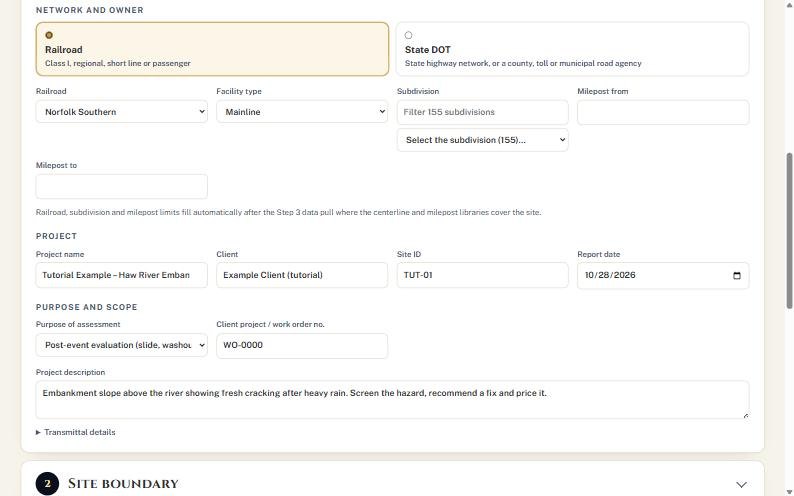
Step one tells NANCY whose network this is and why we are here. Pick railroad or state DOT, name the project and the client, and record the purpose. Everything you type here shows up on the cover and the letter, so spell it the way the client does.
- Under Network and owner, choose Railroad or State DOT. The choice changes the owner list, the facility types and which stabilization techniques NANCY offers later.
- Pick the Railroad (or DOT/road agency) and the Facility type. In the example: Norfolk Southern, Mainline.
- Leave Subdivision and Milepost from/to blank if you don't know them. NANCY fills them after the Step 3 data pull where its centerline and milepost libraries cover the site.
- Enter Project name, Client, Site ID and Report date.
- Set Purpose of assessment. The example uses "Post-event evaluation (slide, washout, slow order or road closure)". Add the client work order number and a one- or two-sentence Project description.
- Open ▸ Transmittal details and fill Prepared by, Title, Attention and Address for the letter.
 1
2
3
4
5
6
- 1Network: Railroad or State DOT.
- 2Owner and facility type.
- 3Subdivision and mileposts can wait for the data pull.
- 4Project, client, site ID, date.
- 5Purpose and description.
- 6Transmittal details for the letter.
- The subdivision box has a filter. Type a few letters to narrow a long list (Norfolk Southern has 155).
- For a DOT site, the state DOT and nearest National Highway System route fill in after the data pull. Enter mile markers from the DOT's linear referencing.
Site boundary
Give NANCY the ground to study. Every later query is made against this outline plus a buffer.
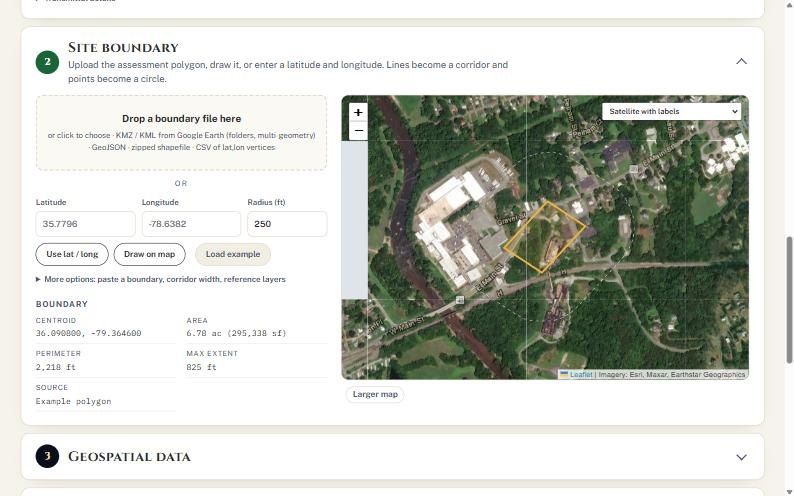
Now we tell NANCY where the site is. Drop in a Google Earth file, draw it on the map, or type a latitude and longitude. A line becomes a corridor, and a point becomes a circle. For practice, Load example gives us a hypothetical embankment near Haw River, North Carolina.
- Choose one way in:
- File: drag a KMZ/KML, GeoJSON, zipped shapefile or CSV onto Drop a boundary file here, or click it to browse. If the file holds several features, pick one in Feature in file.
- Point: type Latitude, Longitude and a Radius (ft), then press Use lat / long.
- Draw: press Draw on map, click each corner, then double-click or press Finish.
- Practice: press Load example.
- Check the Boundary panel: centroid, area, perimeter and maximum extent. If the area looks wrong, the units or the file are wrong.
- Use the basemap menu on the map (for example Satellite with labels) and Larger map to confirm the outline sits on the right slope.
 1
2
3
4
5
6
- 1Drop zone for boundary files.
- 2Latitude, longitude and radius for a point site.
- 3Use lat / long · Draw on map · Load example.
- 4Boundary check: 6.78 ac, 2,218 ft perimeter.
- 5The site outline in gold.
- 6Larger map for a closer look.
Open ▸ More options to paste a boundary as text, set the corridor half-width used when a line is uploaded, or add a KMZ/KML/GeoJSON reference layer (for example a previous survey) to the map.
- Draw the outline around the ground that matters (crest to toe, plus the ditch), not the whole right of way. A large outline dilutes the slope statistics.
- A Google Earth file with folders is fine; check that NANCY picked the feature you meant.
Geospatial data
One click queries federal, state and local sources for the boundary. Everything found is cited in the report.
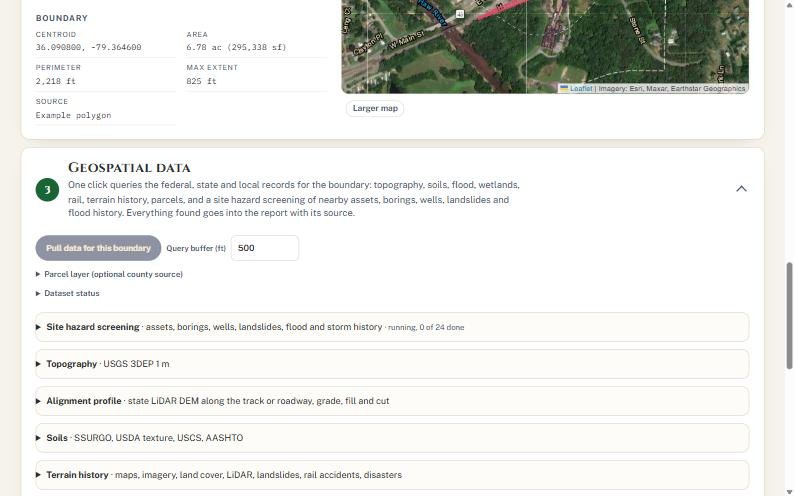
This is the step that used to take days. One button pulls topography, soils, flood zones, wetlands, terrain history, parcels and a hazard screening of everything nearby: bridges, crossings, public borings, wells, landslides and storm history. Each source is listed with how reliable it is and a link to check it yourself.
- Leave Query buffer (ft) at 500 for a typical site. Increase it for a long corridor or a large drainage area.
- Press Pull data for this boundary. The site hazard screening line counts up ("running, 0 of 24 done").
- Optional: open ▸ Parcel layer. Statewide parcels are queried automatically for NC, VT, CT and NY. Elsewhere, paste the county's ArcGIS REST parcel layer URL.
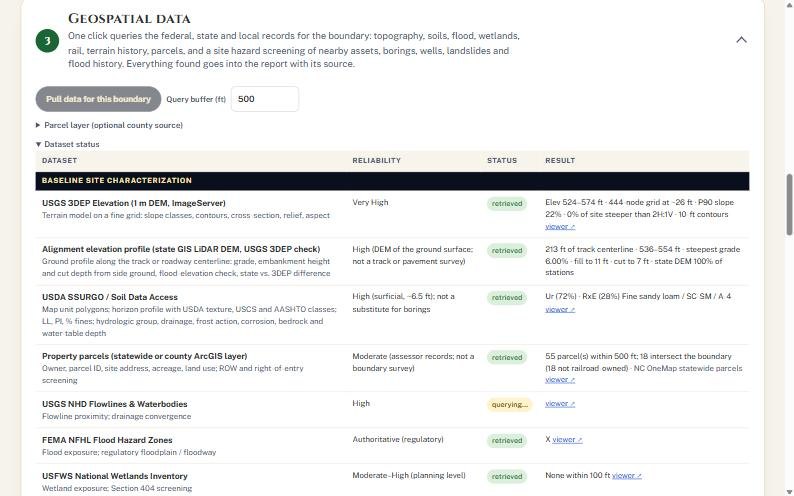
- When the count finishes, open ▸ Dataset status and scan the Status column for anything that is not "retrieved".
 1
2
3
- 1Pull data for this boundary.
- 2Query buffer around the outline.
- 3Progress of the 24 hazard-screening lookups.
Reading the dataset status table
 1
2
3
4
5
- 1Dataset and what it is used for.
- 2Reliability of that source for this purpose.
- 3retrieved: data is in.
- 4querying…: still waiting on the agency server.
- 5Result summary and a viewer link to check it.
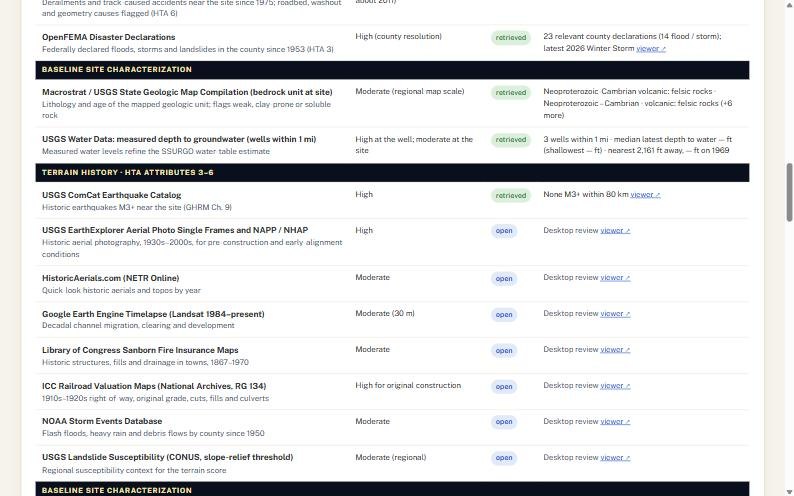
Status chips you will see: retrieved (data in), querying… (still running), failed (the agency server timed out or refused) and open (a desktop review source NANCY cannot read automatically, such as historic aerials or Sanborn maps; use the viewer link and record what you find in Step 4).
 1
2
- 1open: needs your desktop review.
- 2Viewer link straight to the source.
The result panels
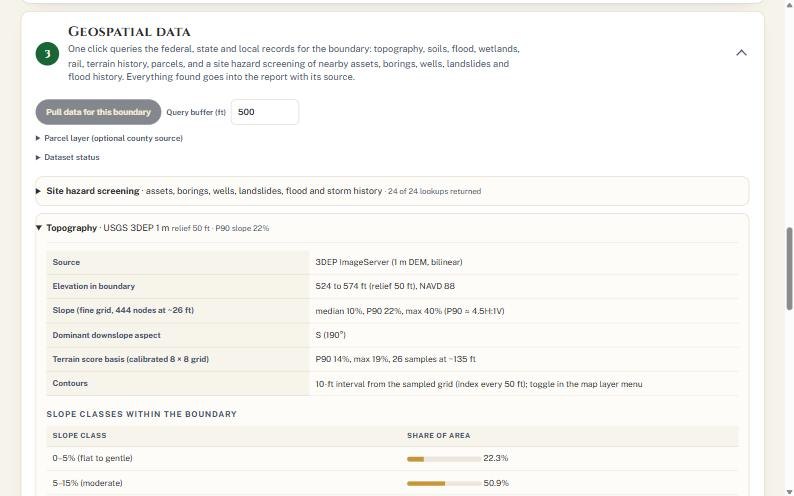
Below the status table, each source has a panel you can open. Two are worth reading every time: Topography and Site hazard screening.
 1
2
- 1Relief, slope percentiles and aspect.
- 2Share of the site in each slope class.
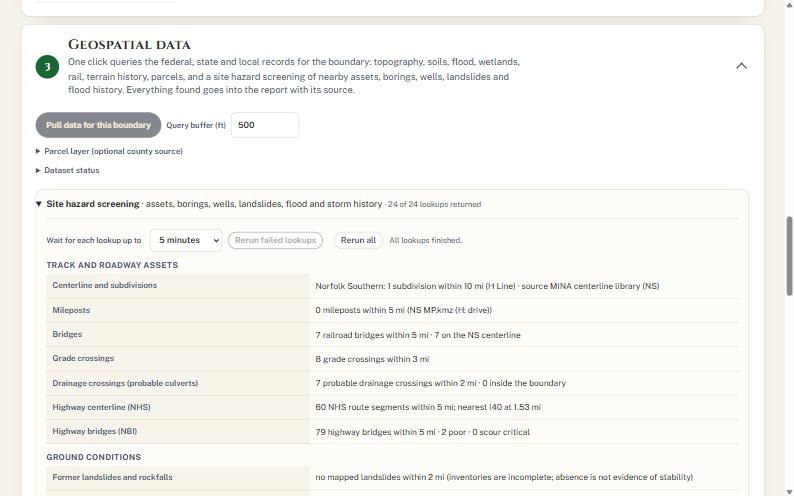 1
2
3
- 1How long to wait for slow servers.
- 2Rerun failed lookups · Rerun all.
- 3Assets, ground, flood and storm findings.
In the example the screening found Norfolk Southern's H Line, 7 railroad bridges within 5 miles, 8 grade crossings within 3 miles, 903 public borings within 10 miles (15 within a mile), and 857 ft of NS track inside the 100-year flood zone within 2 miles. The map in Step 2 now shows the parcels, rail lines and query buffer:
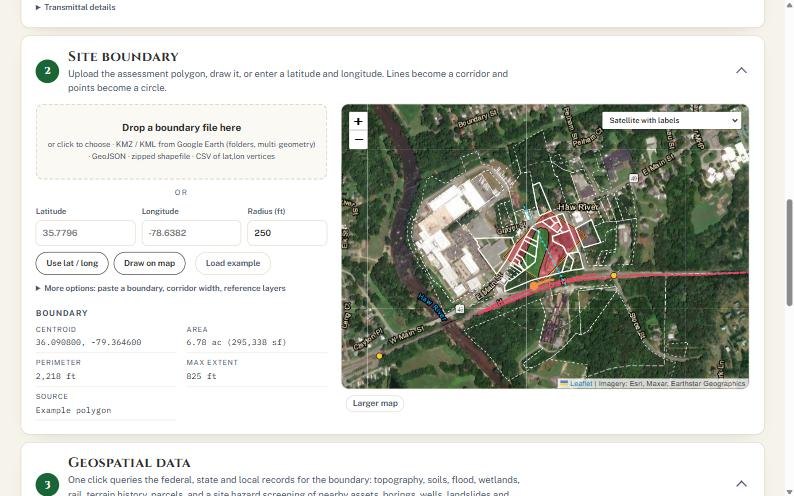 1
2
3
- 1Site boundary.
- 2Mapped rail line.
- 3Parcel lines from NC OneMap; railroad-owned parcels are shaded.
Agency servers are sometimes slow. On the first pull for this script, USGS NHD (streams) timed out after 45 seconds. Its row turned failed and the Hydrology score had no desktop value. Press Rerun failed lookups for the screening items, or press Pull data for this boundary again for the baseline datasets. The second pull retrieved NHD and kept every Step 4 entry. Don't score a site with a failed row you could have rerun.
- "No mapped landslides" is not evidence of stability. Inventories are incomplete, and NANCY says so in the result.
- Raise Wait for each lookup up to (5 to 60 minutes) on a slow connection or a big boundary.
Field verification and operational inputs
The public record is a first look. What you see on the ground today governs.
Until somebody walks the site, the score is provisional. Here we record the visit, score what we see today, and confirm or correct every desktop finding. Where the field and the record disagree, the field wins.
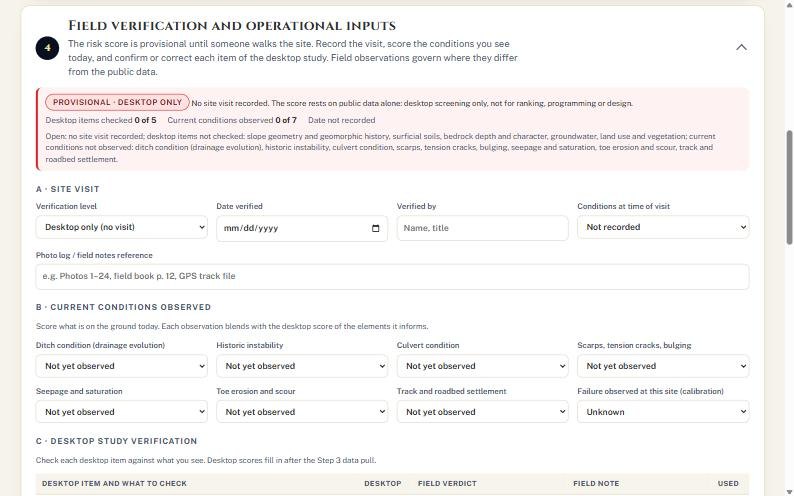 1
2
- 1PROVISIONAL · DESKTOP ONLY: not for ranking or design.
- 2Counters: desktop items checked, conditions observed, date.
- A · Site visit: set Verification level (Desktop only, Hi-rail or drive-by, or Site walked and rated), the Date verified, Verified by, Conditions at time of visit and a photo log reference.
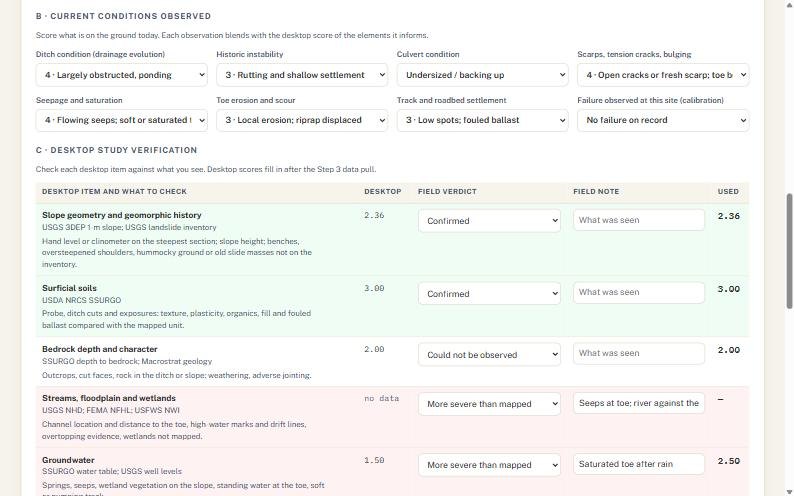
- B · Current conditions observed: score each of the seven observations from 1 to 5: ditch condition, historic instability, culvert condition, scarps/tension cracks/bulging, seepage and saturation, toe erosion and scour, track and roadbed settlement. Leave "Not yet observed" for anything you could not see.
- Set Failure observed at this site (calibration) if the site has a failure or slow order on record.
- C · Desktop study verification: give each desktop item a verdict: Confirmed, More severe than mapped, Less severe than mapped, or Could not be observed. Add a short field note for anything that is not confirmed.
- D · Railroad records and imagery review: score land use and vegetation change, enter track geometry defects in the last 10 years, and add any comment from railroad staff.
- Fill the Traffic, consequence and seismic inputs: MGT or AADT, passenger and hazmat, detour, PGA, speed, trains per day, sight distance, detection, outage days and cost per day, repair cost, third-party exposure and existing mitigation.
- Where they apply, score Other ground hazards (beaver, karst or mine subsidence, debris flow) and the Rockfall rating for rock cuts (USMP/RHRS categories scored 3, 9, 27 or 81).
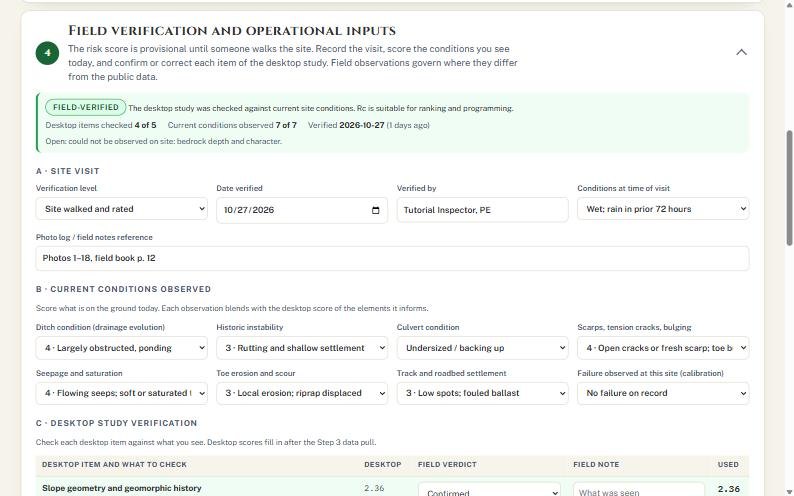 1
2
3
- 1Banner turns FIELD-VERIFIED: 4 of 5 desktop items, 7 of 7 conditions.
- 2Site walked and rated, 27 Oct 2026, wet conditions.
- 3Observations: ponding ditch, undersized culvert, open cracks, flowing seeps.
 1
2
3
4
- 1Desktop score from Step 3.
- 2Your field verdict.
- 3Field note goes into the report.
- 4Score actually used. Groundwater 1.50 → 2.50 after "more severe than mapped".
How the blend works: each field observation you enter is combined with the desktop score of the elements it informs, at 60% field and 40% desktop. A verdict of "more severe" or "less severe" shifts the desktop attribute by a set amount (+1.0 in the example) before it reaches the score. Rows turn green when confirmed and red when worse than mapped.
- Consequence inputs (speed, trains, outage cost, third-party exposure) do not change the hazard score Rc. They drive the risk matrix and the benefit–cost ratios in Steps 5 to 7. Skip them and every BCR will read "risk only".
- Follow your roadway worker protection and track-access rules on site. NANCY's checklist does not replace a job briefing.
Risk score
Six terrain attributes and seven weighted elements roll up to the composite ground hazard score, Rc, from 1 to 5.
NANCY suggests every score and shows its basis. If your judgment differs, type your number in Override and NANCY uses it. The composite Rc sets the risk class, and the class sets the Level of Service: how often to monitor, how many borings, what lab testing, and what the next deliverable is.
- Open ▸ Soil classification basis if you want the soils score to follow AASHTO, USDA texture, or the most severe of the three instead of USCS (the default).
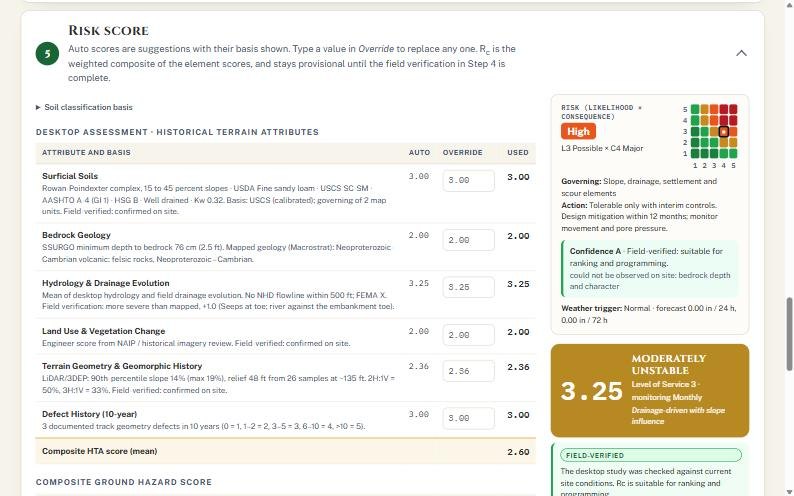
- Read down Desktop assessment · Historical Terrain Attributes. Each row shows the basis in plain words, the Auto score, an Override box and the Used value.
- Type in Override only where you have a reason, and say why in your field notes or report.
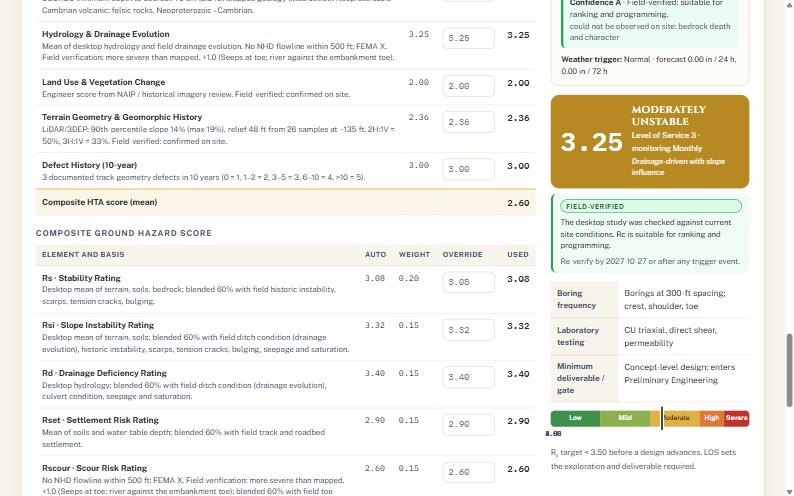
- Read Composite Ground Hazard Score: the seven elements with their weights.
- Read the summary panel on the right: Rc, class, Level of Service, risk matrix, confidence and weather trigger.
 1
2
3
4
5
- 1Auto score from data and field.
- 2Override box.
- 3Used value.
- 4Risk matrix: High (L3 Possible × C4 Major).
- 5Rc 3.25 · Moderately unstable · LOS 3 · monitor monthly.
 1
2
3
- 1Element weights (sum 1.00).
- 2What LOS 3 requires next: borings, lab, deliverable.
- 3Where Rc sits on the class bar.
Reading Rc
The example site scores 3.25, Moderately unstable. The recommended fix in Step 6 brings the residual risk to 2.29, below the program target of 3.50 that a design must meet before it advances.
| Rc | Class | LOS | Monitoring | Borings | Next deliverable |
|---|---|---|---|---|---|
| 1.00–1.99 | Low | 1 | Annual | None, or one shallow boring | Technical memorandum |
| 2.00–2.99 | Mildly variable | 2 | Semi-annual | 1–2 shallow borings, SPT at 5 ft | Sketch-level concept |
| 3.00–3.99 | Moderately unstable | 3 | Monthly | 300-ft spacing; crest, shoulder, toe | Concept design; enters Preliminary Engineering |
| 4.00–4.49 | Highly unstable | 4 | Weekly | 200-ft spacing + 20-ft rock coring | 30% design package |
| 4.50–5.00 | Severe | 5 | Immediate / continuous | 200-ft spacing + deep coring, ≥3 per site | 100% construction documents |
| Element | What it measures | Weight | Example |
|---|---|---|---|
| Rs | Stability rating | 0.20 | 3.08 |
| Rsi | Slope instability | 0.15 | 3.32 |
| Rd | Drainage deficiency | 0.15 | 3.40 |
| Rset | Settlement risk | 0.15 | 2.90 |
| Rscour | Scour risk | 0.15 | 2.60 |
| Rdf | Defect frequency (track geometry history) | 0.10 | from Step 4 D |
| Rp | Priority (traffic, passenger, hazmat, detour) | 0.10 | from Step 4 inputs |
Check the Confidence line under the risk matrix. "Confidence A · Field-verified" means the score is fit for ranking and programming. It also lists what could not be observed (bedrock in the example), which is your list for the boring program.
Stabilization alternatives and residual risk
63 techniques in eight families, screened by what is driving the hazard, priced from the NANCY cost database, and ranked by residual risk and benefit–cost.
Now the second question: what will it take to fix it? NANCY lists the stabilization options that fit this network, prices each one for this state and cost year, and shows how far each brings the risk down. We pick the one that meets the target at a sensible cost.
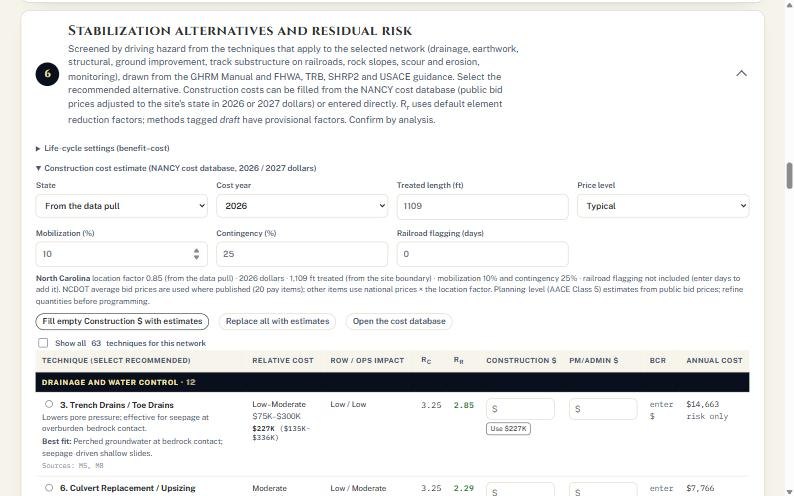
- Open ▸ Construction cost estimate. State defaults to "From the data pull"; set Cost year (2026 or 2027), Treated length (filled from the boundary) and Price level (Low, Typical, High).
- Check Mobilization (10%) and Contingency (25%). Enter Railroad flagging (days) if flagging should be priced.
- Press Fill empty Construction $ with estimates. NANCY fills every blank cost from the database and says how many it filled. Replace all with estimates overwrites costs you typed.
- Open ▸ Life-cycle settings to review the benefit–cost assumptions.
- Read the table. Each technique shows relative cost, ROW and operations impact, Rc → Rr, construction and PM/admin cost, BCR and equivalent annual cost.
- Choose the recommended alternative with the round button at the left of its row. Tick Show all 63 to see techniques that were screened out.
 1
2
3
4
5
- 1State and cost year.
- 2Treated length from the boundary (1,109 ft).
- 3Mobilization, contingency, flagging days.
- 4Fill empty costs from the database.
- 5Show all 63 techniques.
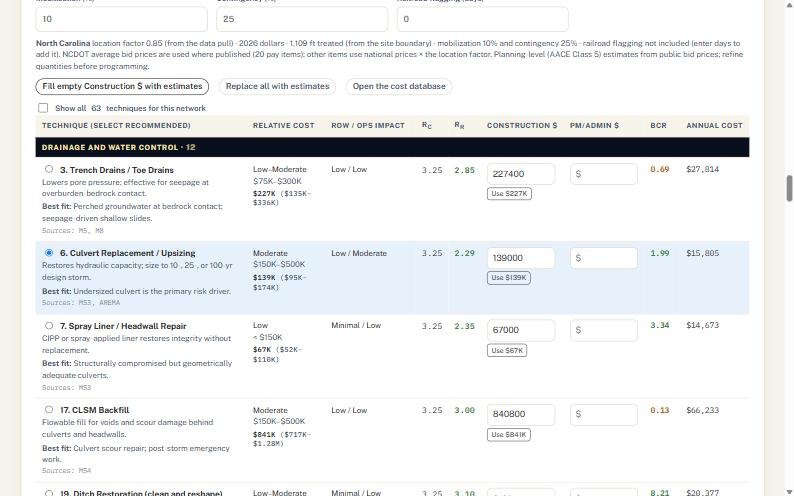 1
2
3
4
- 1Recommended alternative selected.
- 2Rc 3.25 → Rr 2.29.
- 3Construction $139,000 (NCDOT bid prices, 2026 $); Use $ button.
- 4BCR 1.99: avoided risk is about twice the cost.
Why culvert replacement in the example: the field visit found an undersized, backing-up culvert, a ponding ditch and flowing seeps, so drainage drives the hazard. Trench drains cost more ($227K), reduce less (Rr 2.85) and return a BCR of 0.69. Culvert replacement is the "best fit" NANCY names for an undersized culvert, meets the 3.50 target with room to spare, and pays back.
- Costs are planning-level (AACE Class 5) from public bid prices. Refine quantities before programming.
- Techniques tagged DRAFT carry provisional reduction factors. Confirm Rr by analysis before you rely on it.
- Monitoring options (detector fences, instruments, surveys) show a BCR near 0. They manage risk; they do not remove it.
Assessment report
A complete draft report: transmittal letter, site sheet, characterization, field verification, scoring, hazard screening with sources, risk matrix, benefit–cost, action plan, cost basis and limitations.
Last step. Fill in who is responsible for the action plan, press Generate report, and NANCY writes the whole assessment, with every source cited. Print it or save it as a PDF, and save the assessment file so you have the inputs.
- Open ▸ Action plan responsibilities (RASIC) and name who is Responsible, Approver, Support, Informed and Consulted.
- Press Generate report. If any lookups are still running, NANCY waits for them first (up to the wait time you set).
- Read the report top to bottom (pictures below), then press Print / save PDF. NANCY prepares the maps for printing before the print dialog opens.
- Open ▸ Save and export and press Save assessment (.json) to keep the inputs. Export GeoJSON, Google Earth (.kmz) or the parcel list (.csv) as needed.
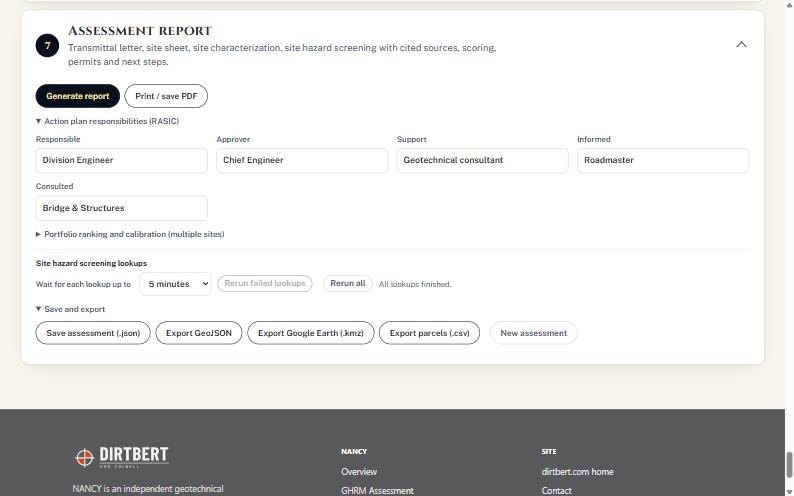 1
2
3
4
5
- 1Generate report.
- 2Print / save PDF.
- 3RASIC responsibilities.
- 4Portfolio ranking and calibration for many sites.
- 5Save and export: .json, GeoJSON, .kmz, parcels .csv, New assessment.
What the report contains
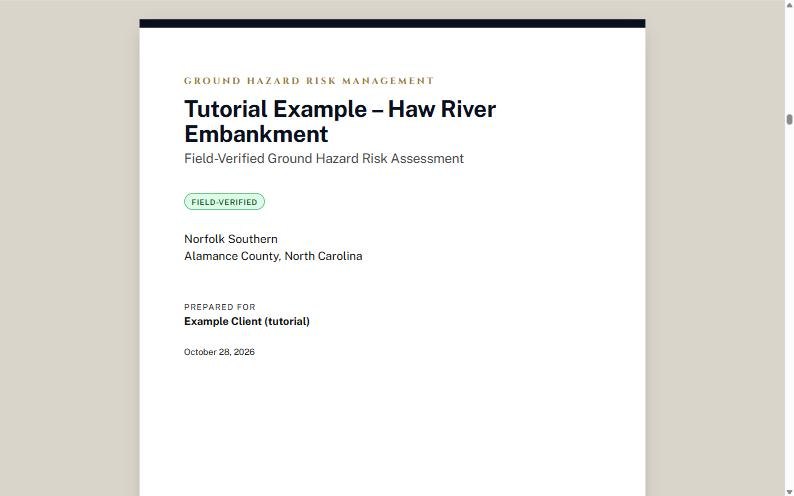
Cover from Step 1, with the verification badge and the county and state from the data pull.
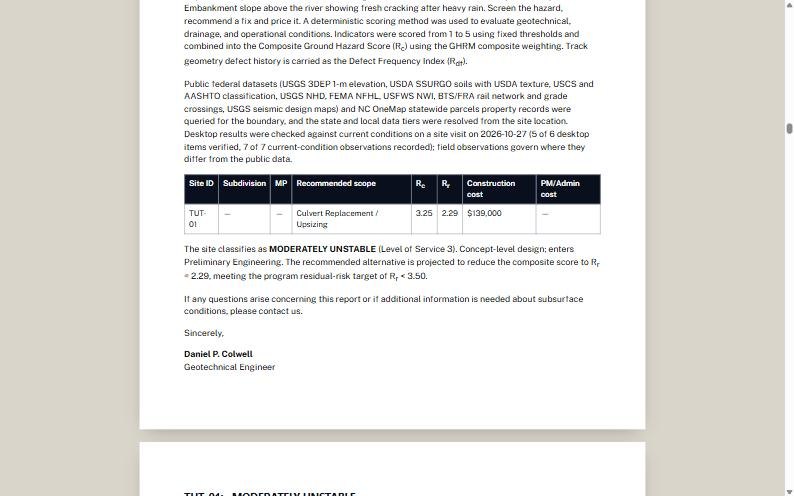 1
2
- 1Summary: Rc, Rr, scope, cost.
- 2Class, LOS and the target sentence.
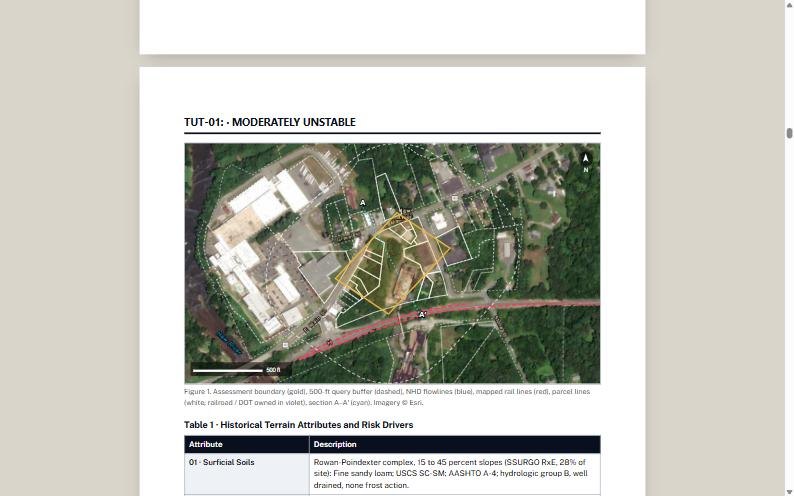 1
2
- 1Figure 1: boundary, buffer, streams, rail, parcels, section A–A′.
- 2Table 1: terrain attributes and risk drivers.
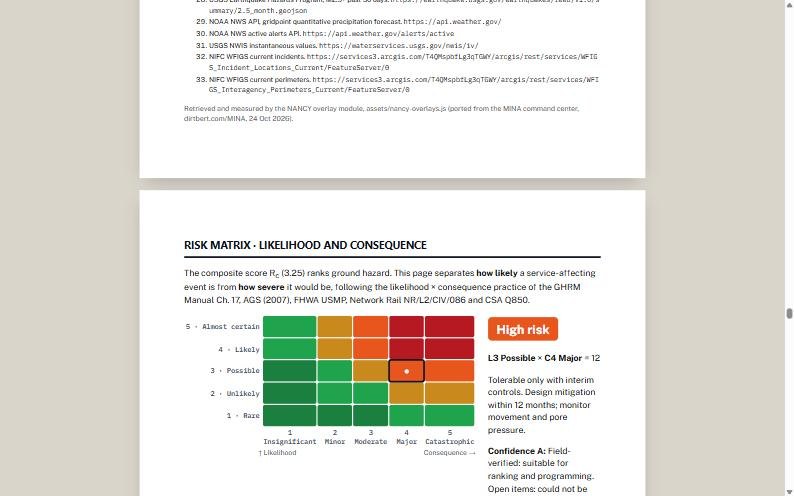 1
2
- 1Site marker: L3 Possible × C4 Major.
- 2High risk: tolerable only with interim controls.
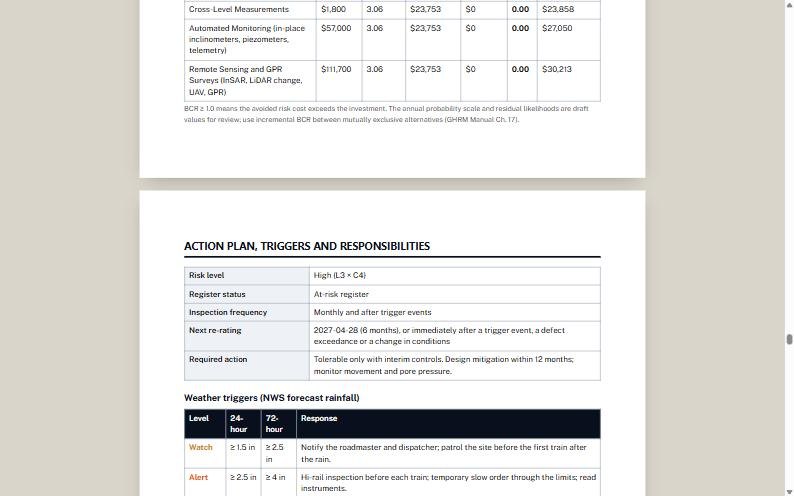 1
2
- 1Inspection frequency and next re-rating date.
- 2NWS rainfall triggers: Watch and Alert responses.
The report sections, in order: cover · transmittal letter · site sheet · site characterization (topography, alignment profile, soils, property) · terrain history · field verification · risk scoring · environmental and regulatory exposure · site hazard screening with numbered sources · risk matrix · life-cycle benefit–cost · action plan, triggers and responsibilities · construction cost basis · limitations and next steps · Appendix C analysis calculations.
The report is a draft for review. Per the Use and Disclaimers, a professional engineer licensed where the project is must check and accept every value before it is used for design, construction or any safety decision.
The cost database
The unit prices behind Step 6, open for anyone to check. Use it when a client asks where a number came from.
- Choose Cost Database in the NANCY menu (or Open the cost database in Step 6).
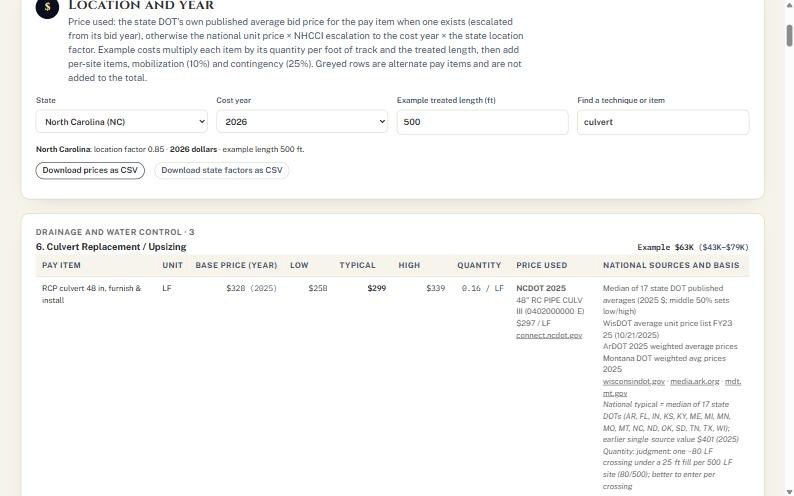
- Pick State and Cost year, and an Example treated length.
- Type in Find a technique or item (for example "culvert") to jump to it.
- Read the Price used column: the state DOT's own published average bid price where one exists, otherwise the national price × escalation × state location factor.
- Press Download prices as CSV or Download state factors as CSV to take the numbers into a spreadsheet.
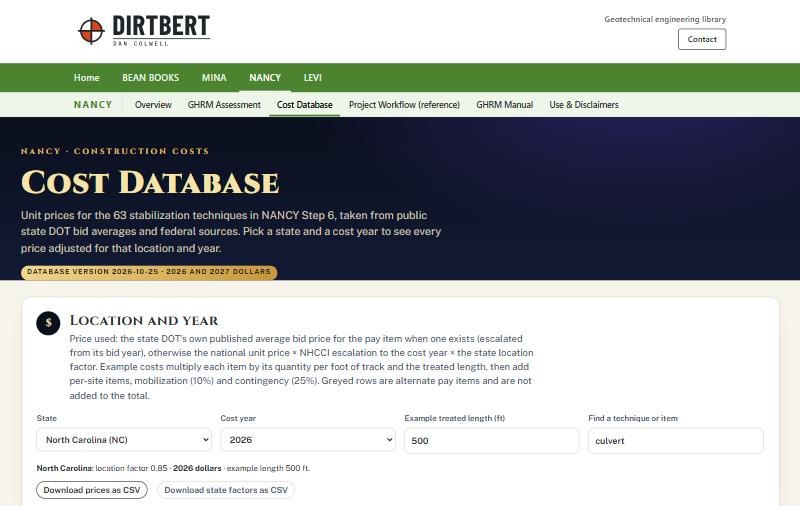 1
2
3
- 1State and cost year.
- 2Find a technique or item.
- 3CSV downloads.
 1
2
3
- 1Pay item, unit and base price year.
- 2Price used: NCDOT 2025 average bid.
- 3National sources and basis.
Lower on the page: the state DOT sources, FRA and railroad sources, state location factors, and the NHCCI escalation table that brings older prices to 2026 and 2027 dollars.
Saving, phones and fixes
Where your work lives, using NANCY in the field, and what to do when something looks wrong.
Where your work is kept
- Your draft saves itself in this browser as you type. Close the tab and come back on the same device and browser, and it is still there.
- Nothing is sent to the dirtbert.com server. Clearing browser data deletes the draft.
- Save assessment (.json) downloads a file of every input and result. Keep it with the project records.
- New assessment clears the draft. It asks for a second click within three seconds ("Click again to clear"), so save first.
- For several sites, use ▸ Portfolio ranking and calibration in Step 7 to rank them on the same terms and export the ranking as CSV.
On a phone or tablet in the field
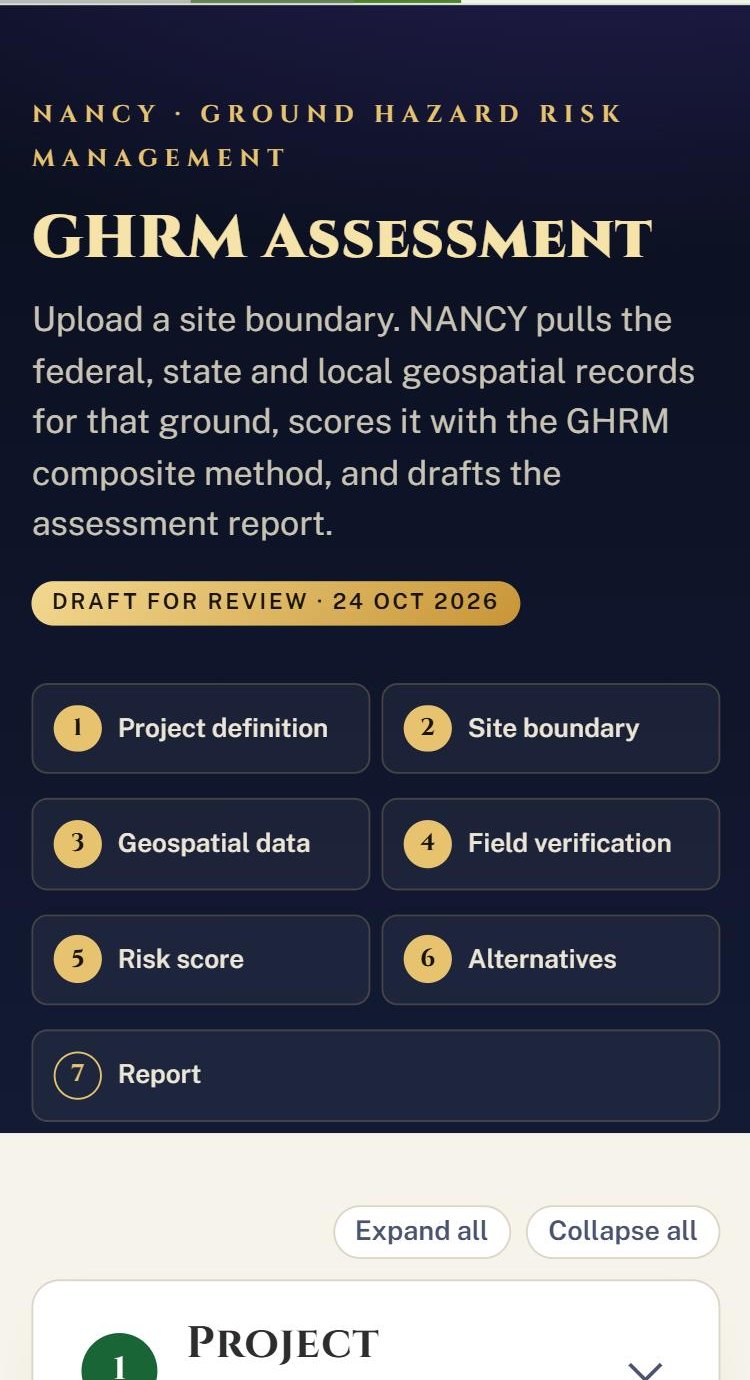
Same page on a phone. Completed steps show filled gold numbers.
- Run Steps 1 to 3 at your desk before the visit, on the same phone you will carry, so the draft is already on it.
- On site, open Step 4 from its tile and score the conditions as you walk.
- Back at the desk, finish Steps 5 to 7. If you used a different device on site, re-enter the Step 4 scores from your field book.
Fill the Photo log / field notes reference box with your photo numbers and field book page so the report ties back to your records.
When something looks wrong
| What you see | Why | What to do |
|---|---|---|
| A dataset row says failed or "timed out" | The agency server was slow or down | Press Rerun failed lookups, or press Pull data for this boundary again. Field entries are kept. |
| Hydrology or another element shows "no data" or "—" | Its source failed or is still running | Wait for the count to finish, then rerun. |
| Red PROVISIONAL · DESKTOP ONLY banner | No site visit recorded | Complete Step 4 A and B. Don't use the score for ranking or design until then. |
| BCR reads "risk only" or "enter $" | Consequence inputs or costs are missing | Fill outage days, outage cost per day and repair cost in Step 4, then press Fill empty Construction $ with estimates. |
| Subdivision or milepost stays blank | The centerline or milepost library doesn't cover the site | Type them in Step 1. |
| No parcels found | Outside NC, VT, CT and NY there is no statewide layer | Paste the county's ArcGIS REST parcel layer URL under ▸ Parcel layer. |
| The disclaimer page appears again | New browser, private window, cleared data, or the terms changed | Read and accept again. |
| The draft is gone | Different browser or device, or browser data cleared | Start again from the saved .json details, or re-run Steps 1 to 3. |
Terms and checklist
The words NANCY uses, and a one-page list to tick off for every site.
- Rc
- Composite ground hazard score, 1 to 5. The weighted sum of seven elements; it sets the class and Level of Service.
- Rr
- Residual risk after a chosen fix. The program target is below 3.50 before a design advances.
- HTA
- Historical terrain attributes: surficial soils, bedrock, hydrology and drainage, land use and vegetation, terrain geometry, defect history.
- LOS
- Level of Service. What a class requires next: monitoring frequency, borings, lab testing and deliverable.
- Field weight
- The 60% share a field observation carries when blended with the desktop score.
- BCR
- Benefit–cost ratio. Above 1.0, the avoided risk cost exceeds the investment.
- RASIC
- Responsible, Approver, Support, Informed, Consulted: who owns each part of the action plan.
- MGT / AADT
- Million gross tons per year (rail) or annual average daily traffic (highway). Both feed priority and consequence.
- AACE Class 5
- Planning-level cost estimate accuracy. Fine for screening and ranking, not for bids.
Site checklist
- Use and Disclaimers accepted on this device
- Step 1: network, owner, facility, project, client, site ID, purpose
- Step 1: transmittal details for the letter
- Step 2: boundary loaded and checked on the map
- Step 3: data pulled; no failed rows left
- Step 3: "open" desktop sources reviewed
- Step 4: site visit level, date, inspector, conditions
- Step 4: seven current conditions scored
- Step 4: every desktop item given a verdict
- Step 4: traffic, consequence and outage inputs
- Step 5: overrides justified in notes
- Step 5: Rc, class, LOS and confidence read
- Step 6: state, year, length, price level set
- Step 6: costs filled; recommended fix selected
- Step 6: Rr below 3.50
- Step 7: RASIC names entered
- Step 7: report generated and saved as PDF
- Step 7: assessment saved as .json