
Geotechnical engineering libraryContact
 benesch
Railway Ground Hazard Risk Management
Primary sources: Selig, E.T. and Waters, J.M. (1994), Track Geotechnology and Substructure Management; Li, D., Hyslip, J., Sussmann, T. and Chrismer, S. (2016), Railway Geotechnics; Cruden, D.M. and Varnes, D.J. (1996), Landslide Types and Processes, TRB Special Report 247; Hungr, O., Leroueil, S. and Picarelli, L. (2014), The Varnes classification of landslide types, an update, Landslides 11; Caine, N. (1980), The rainfall intensity–duration control of shallow landslides and debris flows, Geografiska Annaler 62A; FHWA HEC-18; FRA 49 CFR Part 213; and Chapters 1, 2, 3 and 13 of this manual.
New chapter drafted September 2026 for the Railway Ground Hazard Risk Management reorganization. Verify client-specific values against the governing client standard before use on a project.
Apps on dirtbert.com that support this chapter. Each one runs in a web browser on a desktop or a phone, with nothing to install. How to use the apps (I.3). Tools marked TOOLS open in the Geotechnical Analysis Suite (Benesch sign-in); the orange card below lists each one by section.
NANCY pages ask you to accept the Use and Disclaimers once in each browser. MINA is a monitoring aid and is not for operational dispatch decisions.
Calculators and workbook tools from the Benesch Geotechnical Analysis Suite that support this chapter: 5 interactive calculators and 1 workbook guide. Each one is also placed inside the section it supports, in an orange tools strip.
| SS | Residual & Fully Softened Strength CorrelationsUsed in 4.3 Embankment and Slope Failure Mechanisms | Calculator ▸ | Guide |
| SS | Seismic Slope Displacement (Bray–Travasarou)Used in 4.6 Seismic Mechanisms | Calculator ▸ | Guide |
| ST | Heave CalculationsUsed in 4.2 Track Substructure Failure Mechanisms | Calculator ▸ | Guide |
| GW | Infiltration Calculations & ProcedureUsed in 4.8 Rainfall Thresholds and Weather-Based Operating Protocols | Calculator ▸ | Guide |
| FF | Field Observation DataUsed in 4.10 Monitoring and Early-Warning Indicators | Calculator ▸ | Guide |
| GW | UnderseepageUsed in 4.4 Hydraulic Failure Mechanisms | guide only | Guide |
Tools open on dirtbert.com and need the Benesch sign-in. Drafts pending Benesch final review, not for use in design.
General topic illustrations from Benesch's shared geotechnical graphics library, related to this chapter's subject matter — not the numbered figures called out in the text. Click any image to view it full size.
Chapter 1 classifies railway ground hazards by what they are: landslide, hydraulic erosion and subsidence. This chapter explains how they happen. For each family of hazard it describes the physical failure mechanism, the conditions that make a site susceptible, and the triggers that turn susceptibility into an event.
The distinction is practical. Mitigation that addresses only the trigger (for example, a rain-based slow order) manages exposure but leaves the hazard in place. Mitigation that addresses the mechanism (drainage, buttressing, subgrade replacement) reduces the hazard itself. Correctly diagnosing the mechanism is therefore the step that controls whether repair money solves the problem or only treats the symptom. Chapter 1 makes this point about "muddy track": identical surface symptoms can come from quite different root causes.
Key outputs: a mechanism–condition–trigger framework (Section 4.1); mechanism tables for track substructure, embankments and slopes, hydraulic, subsidence and seismic hazards (Sections 4.2–4.6); a trigger inventory (Section 4.7); the use of rainfall thresholds in weather-based operating protocols (Section 4.8); a symptom-to-mechanism diagnostic table (Section 4.9); and monitoring indicators (Section 4.10).
The correlations below are used or referenced in this chapter. Each is a statistical fit to a particular data set, so a value from one is an estimate: it applies only within the materials and ranges stated, carries the scatter of the original data, and must be confirmed by site-specific testing or calibration before it is relied on for design.
When an equation is used, note it with the result: give the equation ID and source, state that the soil or rock is within its range of applicability, mark the value as correlated (not tested), and record the limitation that governs. The Empirical Equations & Correlations reference has every entry with its full references.
Variables. Each of ~12 categories (slope height, ditch effectiveness, average vehicle risk, sight distance, roadway width, geology, block size/volume, climate, rockfall history) scored by its own x-function
Use. Prioritizing highway (and adapted rail) rock slopes for remediation.
Limitations. Relative ranking, not a probability of failure. Rail adaptations (e.g., corridor-specific USMP / RHRS variants) modify categories.
Source. Pierson et al. 1990 · In this chapter: 4.9 · Full entry and references
Variables. I = mean rainfall intensity; D = rainfall duration
Use. Shallow landslides and debris flows, global data (73 events); 10 min < D < 10 days.
Limitations. Lower-bound global threshold; regional thresholds are typically much higher. Ignores antecedent moisture.
Source. Caine 1980 · In this chapter: 4.8, 4.15 · Full entry and references
Variables. H = vertical drop crown-to-toe; L = horizontal travel; V = volume (m³)
Use. Large rock avalanches (V ≳ 105 m³).
Limitations. Mean trend only; ~half of events travel farther. Topographic confinement and saturated path material increase mobility.
Source. Scheidegger 1973 · Full entry and references
Variables. V = volume (m³); H = elevation difference (m)
Use. Debris flows (Alpine and worldwide data); V roughly 102–107 m³.
Limitations. Represents upper-envelope behaviour for some subsets; scatter roughly ±factor of 2.
Source. Rickenmann 1999 · Full entry and references
Variables. Rc = bend centerline radius; Δh = superelevation across flow; b = flow width; k = correction factor (≈1 in Hungr et al.; field calibrations ~1–5)
Use. Back-calculating velocity from post-event mud lines at channel bends.
Limitations. Assumes forced-vortex flow; k is poorly constrained and strongly affects results.
Source. Hungr et al. 1984 · Full entry and references
Use. Global minimum threshold from 2,626 rainfall events triggering shallow landslides and debris flows; 0.1 < D < 1,000 h.
Limitations. Absolute minimum for warning; not a site-specific trigger. Develop regional/corridor thresholds for early-warning systems.
Source. Guzzetti et al. 2008 · Full entry and references
Variables. Dn = displacement (cm); ac = critical (yield) acceleration; amax = peak ground acceleration
Use. Rigid-block seismic slope displacement; 2,270 strong-motion records.
Limitations. Rigid-block assumption unsuitable for deep, compliant slides; ±0.510 is one standard deviation in log units. Alternative forms use Arias intensity or magnitude.
Source. Jibson 2007 · Full entry and references
Variables. RMRb = basic RMR (no orientation adjustment); F1 parallelism of joint/slope strike; F2 joint dip (planar); F3 joint-to-slope dip relation; F4 excavation method (+15 natural to −8 deficient blasting)
Use. Rock slopes; planar and toppling modes (wedge by pairwise check).
Limitations. Continuous-function forms (Tomás et al. 2007) reduce step artifacts. Does not replace kinematic and limit-equilibrium analysis.
Source. Romana 1985 · Full entry and references
Variables. β = angle from apex of talus slope to the farthest rockfall fragment
Use. Rockfall runout below talus slopes; based on 16 talus slopes in British Columbia.
Limitations. Preliminary zoning only; use calibrated 2-D/3-D trajectory modelling for design of barriers or ditches.
Source. Evans & Hungr 1993 · Full entry and references
Ground failures rarely have a single cause. It is useful to separate three groups of factors:
| Factor | Definition | Railroad Examples | Can the Railroad Change It? |
|---|---|---|---|
| Predisposing conditions | Inherent site characteristics that make failure possible | Soft or sensitive clay, steep slope, fouled ballast over plastic clay, soluble bedrock, loose saturated sand | Only by engineering works (improvement, regrading, replacement) |
| Preparatory (progressive) factors | Processes that reduce the margin of safety over time | Ballast fouling, subgrade softening, toe erosion, weathering, rising tonnage, culvert corrosion, creep | Yes — through maintenance, drainage and inspection |
| Triggers | The event that tips a marginal site into failure | Intense or prolonged rainfall, snowmelt, flood, rapid drawdown, earthquake, toe excavation, blocked culvert | Rarely — but exposure can be managed (slow orders, patrols, warning systems) |
The factor of safety concept from Chapter 1 ties these together. Predisposing conditions set the starting factor of safety, preparatory factors erode it, and the trigger is whatever finally pushes it below 1.0. A site with a large margin survives the same storm that fails a marginal site next to it. This is why a risk program targets sites whose margin is being eroded, not just sites that have already failed.
Bissonette separates three things that risk registers often blur. A cause is a fact or existing condition. A risk is an uncertain event that may or may not happen. An effect is the possible impact on one or more project objectives (schedule, cost, scope or quality). To keep them apart he uses a fixed sentence form, or risk metalanguage:
As a result of <CAUSE>, <RISK> may occur, which will lead to <EFFECT>.
The short version for a register title is “<RISK> due to <CAUSE>.” One of his examples reads: “As a result of more than expected test failures, more design/build/test cycles may occur, which will lead to schedule delays and added project costs.” Its register title is “More design/build/test cycles due to more than expected test failures.” Writing every risk this way shows which part can be measured or controlled, whether the cause or the event. It also indicates which objective the impact rating should refer to. The same form keeps a known condition, which is a fact to design for, from being logged as though it were uncertain.
For railroad work: The metalanguage lines up with this chapter’s condition–mechanism–trigger framework. The cause is the condition plus the trigger, the risk is the mechanism being activated, and the effect is the consequence to track or to the project. For example: “As a result of a high-plasticity clay subgrade with a clogged ditch line (condition) and sustained wet-season rainfall (trigger), progressive shear and heave of the subgrade may occur (mechanism), which will lead to repeated surfacing, a slow order and possible mud-pumping derailment risk (effect).” The register title becomes “Subgrade shear failure due to saturated CH subgrade and blocked drainage.” Writing hazard and project risks in this form makes plain which field observation would confirm the cause and which treatment targets the trigger. It also makes the risk register consistent with the diagnostic tables in this chapter.
Source: Bissonette, M. M. (2016). Project Risk Management: A Practical Implementation Approach. Newtown Square, PA: Project Management Institute, Ch. 3, “Causes Versus Risks” (unpaginated e-book; PDF pp. 38–40). Summarized and paraphrased. Full reference under Supplemental Sources.
These mechanisms act within the ballast, subballast and subgrade (Chapter 2) and the upper part of the embankment (Chapter 3). They account for most of what track patrols encounter day to day: the "subsidence" category of Chapter 1.
| Mechanism | What Happens | Susceptible Conditions | Field Indicators | See |
|---|---|---|---|---|
| Ballast degradation and fouling | Particle breakage and abrasion, plus infiltration of fines, fill voids and reduce drainage and strength | Weak or soft aggregate, heavy tonnage, tamping cycles, wind-blown or spilled fines | Fouled shoulders, reduced voids, geometry loss after surfacing | Chapter 2, Section 2.7 |
| Subgrade attrition and mud pumping | Water plus cyclic loading at the ballast–subgrade contact produces a slurry that is pumped into the ballast | Plastic fine-grained subgrade, no or inadequate subballast, poor drainage | Mud at tie ends and in cribs, "white spots" on shoulders, rapid surface defects | Chapter 2, Section 2.5 |
| Progressive shear failure | Repeated stress near the subgrade strength remolds the soil and squeezes it laterally beneath the ties | Soft, wet fine-grained subgrade; thin granular layer | Heave of the ballast shoulder or ditch side ("subgrade squeeze"), ties hanging, recurring cross-level defects | Chapter 2, Section 2.5 |
| Excessive cumulative plastic deformation | Gradual accumulation of permanent strain under millions of load cycles forms ballast pockets and troughs | Fine-grained subgrade with moderate strength; heavy axle loads | Ballast pockets in trench sections; gradual long-wave settlement | Chapter 2, Section 2.5 |
| Consolidation settlement | Volume decrease of saturated clay and organic soil under sustained load | Soft clay or peat foundations; new fill, raises or a second track | Long-wave settlement, often continuing for years after construction | Chapter 12 |
| Frost heave and thaw weakening | Ice lens growth heaves track in winter; excess water on thaw softens the subgrade | Frost-susceptible silts and silty clays, available water, freezing climate | Seasonal differential heave, spring pumping and soft spots | Chapter 2, Section 2.5; Chapter 18 |
| Swell and shrinkage | Moisture change in expansive clay causes volume change | High-plasticity clay, clay shale in cuts, seasonal wetting and drying | Seasonal geometry cycling, shoulder cracking in dry periods | Chapters 3, 8 |
| Cyclic softening ("subgrade dynamic liquefaction") | Pore pressure buildup under repeated loading in saturated low-plasticity silt causes loss of strength | Saturated silts, poor drainage | Sudden loss of support in wet periods, mud boils | Chapters 1, 14 |
Profillidis uses a maintenance coefficient k = I / Im, where I is the annual number of maintenance sessions on a section and Im the average for track of the same age, UIC group and axle load. k = 1 is average; k = 0.5 is good; on poor subgrade k can reach 10. Maintenance hours rise steeply with k and with years since renewal (Figure 4-1). He uses k to judge whether the track bed is adequately sized:
| k | Assessment |
|---|---|
| k < 1 | Correct dimensioning |
| 1 < k < 2.5 | Track-bed structures slightly under-dimensioned |
| 2.5 < k < 5 | Track-bed structures under-dimensioned; poor functioning of drainage |
| k > 5 | Renewal and strengthening of track-bed structures necessary |
When I passes a threshold, geometry can no longer be held by surfacing alone and the remedy is to reduce k, mainly by thickening the track bed. Applied with Dormon’s rule, subgrade stress also depends on maintenance: traffic between sessions scales with T/k, so tracks with different k values load the subgrade differently. For a ground-hazard program the practical point is that a segment needing repeated spot surfacing (high k) is evidence of a substructure mechanism, and that evidence lives in maintenance records.
Figures · click to zoom
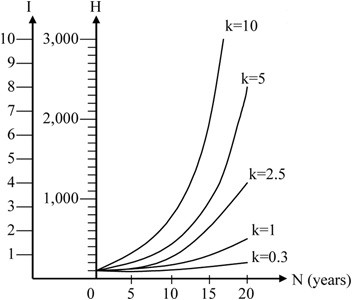
After Profillidis (2014), §9.9, Table 9.5, Fig. 9.6. Full reference under Supplemental Sources.
Short-term versus long-term settlement. On most track, ballast causes most of the settlement between surfacings, both average and differential. This is the short-term component. The subgrade adds a long-term component that builds slowly over decades of traffic. Ballast governs only when three conditions hold:
If any of these is missing, the subgrade dictates the maintenance cycle.
Why track subgrade fails by creep, not by sudden collapse. Train loading on the subgrade does not reverse the direction of shear stress. Under that kind of loading, pore pressure rises to a limit and failure comes as permanent strain accumulating at an increasing rate. Cyclic strain stays small. Two factors make it worse:
After Selig & Waters (1994), chs. 3, 4 and 8. Full reference under Supplemental Sources.
Classify slope movements by material (rock, debris, earth) and movement type (fall, topple, slide, spread, flow), following Cruden and Varnes (1996) as adopted in Chapter 1. The mechanism determines the analysis method (Chapter 13) and the likely warning time.
| Mechanism | Typical Railroad Setting | Warning Signs | Warning Time |
|---|---|---|---|
| Rotational slide (slump) | Embankments and cuts in clay; river-bank fills | Crest cracks parallel to track, back-tilted blocks, bulging toe | Days to months; often progressive |
| Translational slide | Fill over sloping bedrock or weak planar layer; colluvium | Tension cracks upslope, displaced ditch, leaning poles | Hours to weeks |
| Earthflow and retrogressive slide | Sensitive and quick clays in river valleys | Often little; small initial slide at the bank | Minutes to hours once started |
| Lateral spread | Sensitive clay or liquefiable layers near free faces | Ground cracking, bulging toward channel | Rapid |
| Debris flow | Steep channels above track; source areas often out of sight | Accumulated debris in upper channel, burn scars, intense rain | Minutes; can reach track 1–2 miles from source (Chapter 1) |
| Rockfall and topple | Rock cuts and natural rock faces | Fresh debris in ditch, open joints, freeze-thaw season activity | Seconds |
| Creep | Clay slopes and colluvium | Curved tree trunks, slow drift of track alignment and structures | Years; may accelerate to sliding |
| Shallow sloughing and surface erosion | Steep, unvegetated fill slopes | Rills and gullies, slumped surface layer | Storm-dependent |
| Embankment spreading or foundation squeeze | Embankment on soft foundation | Toe heave, lateral displacement, crest settlement | Weeks to months |
Mass movements are classified by rate against water content, from extremely slow dry creep through earthflows and rotational or translational slides to extremely rapid rockfalls, debris flows and debris avalanches in saturated ground. An earthflow has a characteristic hourglass shape. Creep is spotted by its effects: curved trunks, bent fences and tilted poles.
Embankment collapse by internal erosion (rated Severe) is the hidden mode. Water moves through the fill or overflows through buried rock drains, carrying soil out and leaving voids until the surface collapses. In one case a culvert roof failed about 45 ft inside the fill and produced a sink hole up to 70 ft deep. In another, a 6.5-ft multi-plate culvert with a rusted-out invert let water erode beneath it, causing outlet and toe scour, an over-steepened slope, head-scarp cracks, 14 in. of mainline settlement and 2 in. of lateral deflection.
Figures · click to zoom
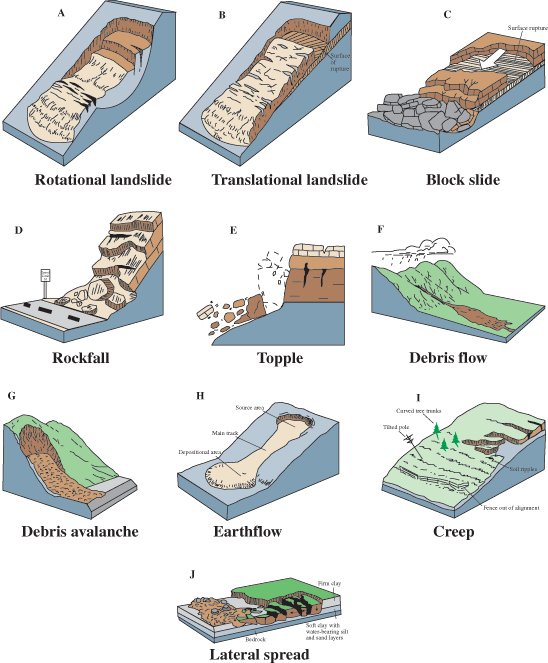
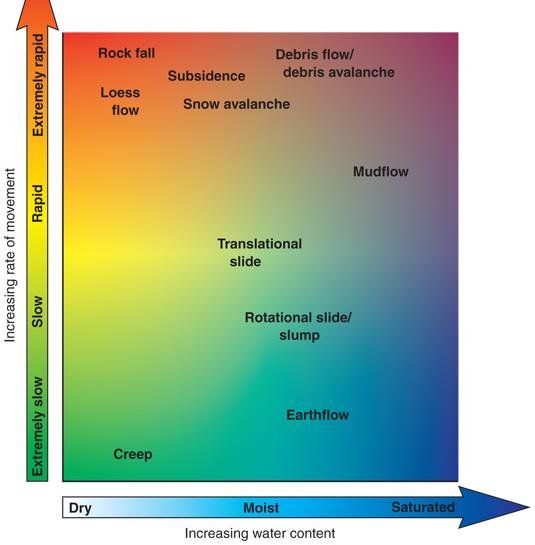
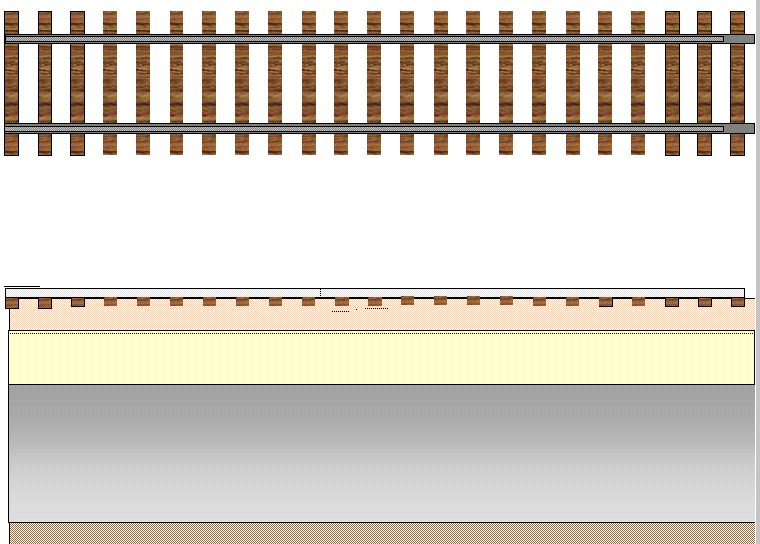
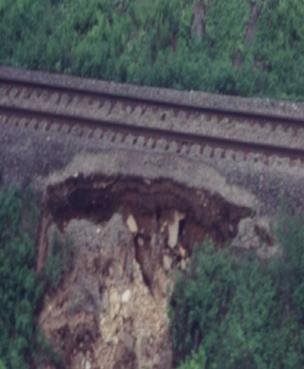
After Geotechnology for Railroaders Program, Module 5; §05, §09, §14. Full reference under Supplemental Sources.
Case study: 4.16.1 Slope failures whose consequences left the site (Look 2023), in §4.16 Case Studies.
Chapter 1 splits hydraulic erosion into surface-flow and seepage mechanisms. They fail differently and call for different controls.
Undersized drainage is a hydraulic mechanism in its own right. Profillidis gives the U.S. Soil Conservation Service method based on Fuller’s formula for the peak flow from a catchment of A km² for a return period of T years:
His worked values: A = 10 km², T = 10 years gives Q1 = 11.6 and Qmax = 47.7 m³/s; A = 15 km², T = 20 years gives 15.7 and 69.9 m³/s. He cautions that such semi-empirical formulas must be checked against measured data. On the TGV Méditerranée, observed extreme runoff was about twice the top of the predicted range (Chapter 3, §3.5). He argues that increasing rainfall intensity calls for return periods far longer than the traditional 50–100 years, up to 1,000 years, with the probable maximum flood as the reference event.
After Profillidis (2014), §9.14.2–9.14.3, Eq. 9.11. Full reference under Supplemental Sources.
Local scour forms horseshoe and wake vortices around piers and abutments; contraction scour deepens the channel through a constricted opening. Both can undermine a foundation well below the water surface. Away from bridges, any bend near the track is scour-critical: the outer radius scours while the inner radius deposits. Banks migrate as the stream undercuts and collapses them. Attack migration before it passes a 2:1 intercept slope with the track, because cost rises steeply with delay, and get engineering help, since riprap alone may not be enough.
Signals stay green when track is undermined by side scour or washed out. Peak flow can arrive after the rain stops, and a long moderate storm can do more damage than a short intense one. Get off the hi-rail and walk the bank at scour-critical locations. AREMA countermeasures (after FHWA) are riprap at piers and abutments, guide banks, spurs and revetments, with riprap always placed from the toe upward.
Figures · click to zoom
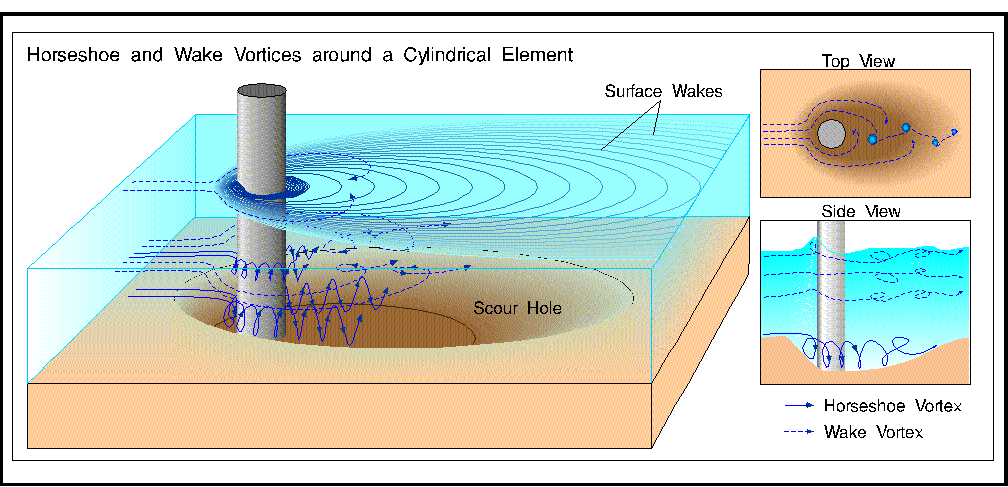
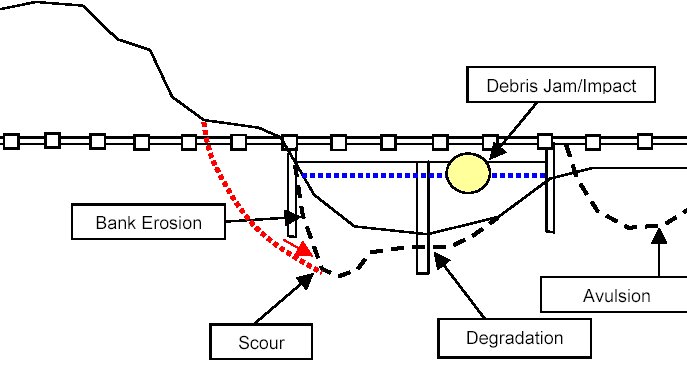
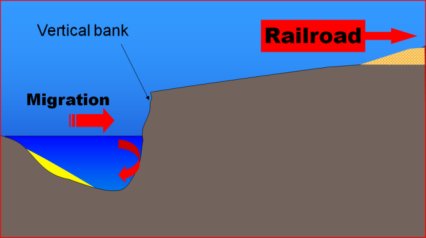
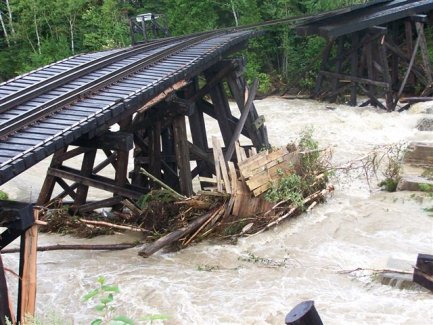
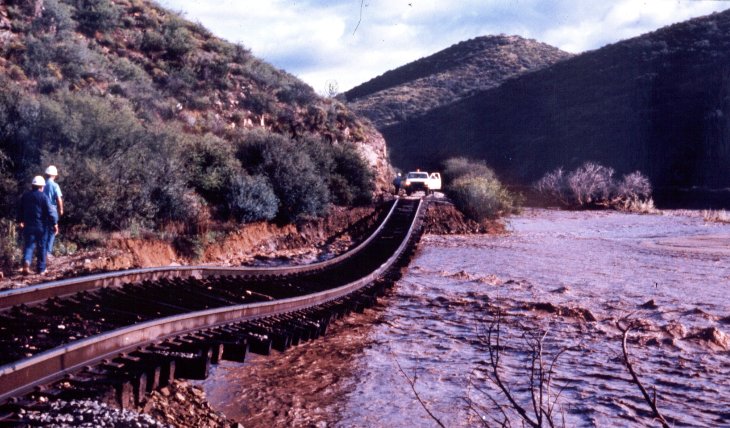
After Geotechnology for Railroaders Program, Module 6.3; §02–05. Full reference under Supplemental Sources.
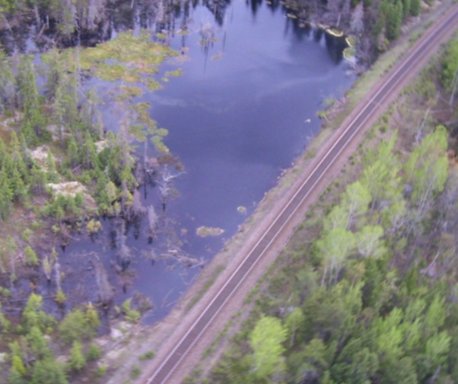
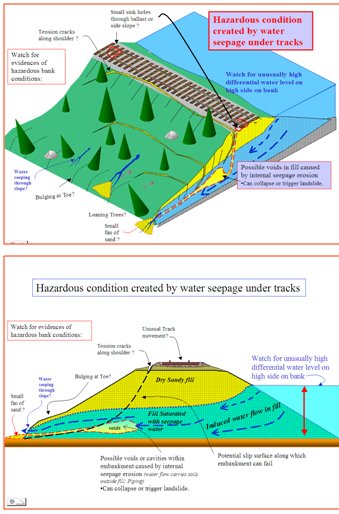
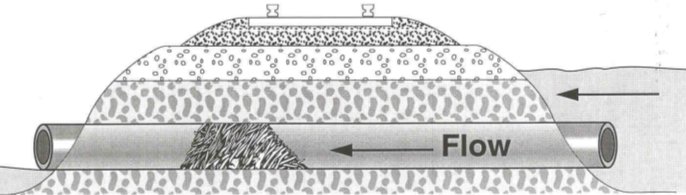
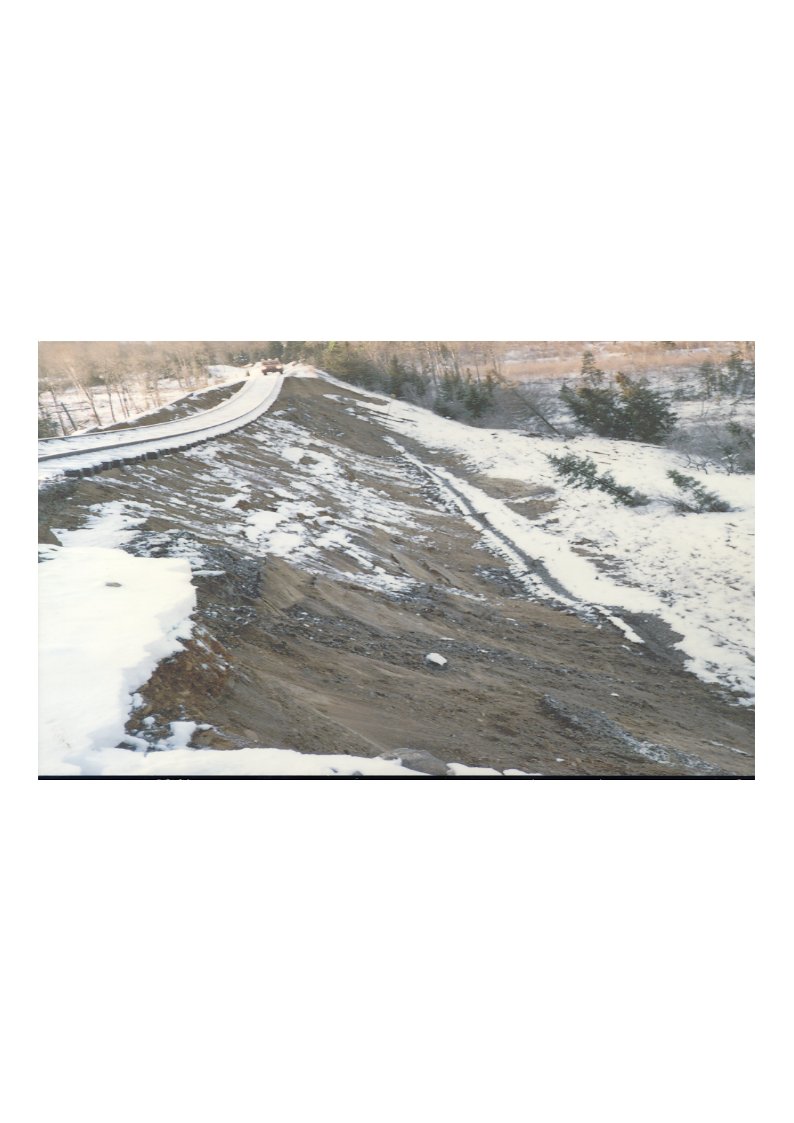
When the water level on one side of an embankment exceeds the other by more than about 6 ft, flow is forced beneath the track. Within days, depending on the fill, wet spots appear at the downhill toe. Dirty or milky seepage and sand fans at the outlet mean soil is being carried out and cavities are forming. In spring, a culvert plugged with ice is the most frequent cause.
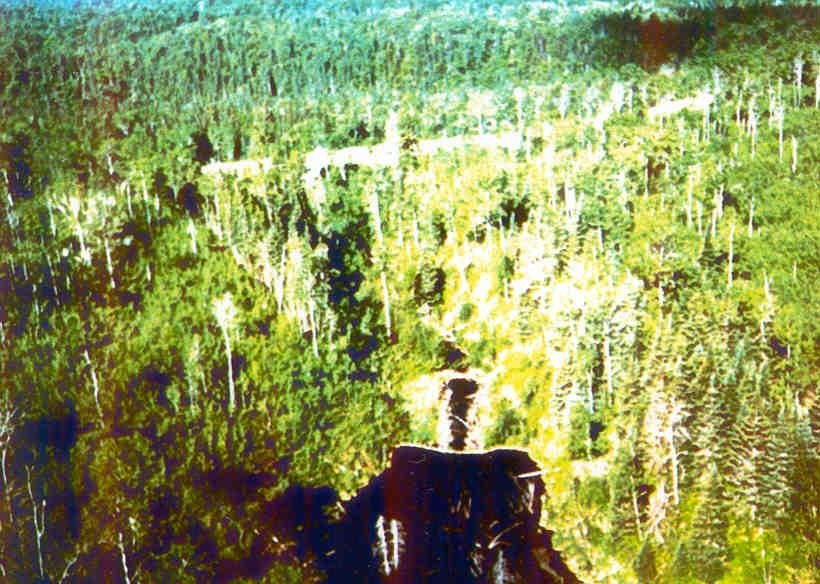
Beaver dams in culverts and ditches cause about 80% of beaver trouble but less than 10% of the risk. Dams far uphill, sometimes 100 ft or more above the track and outside railway property, are about 20% of problems but carry the highest risk. The 1992 Nakina derailment, in which two employees were killed, followed a rapid drawdown of a lake after a dam failure and led to the formal Beaver Activity Hazard Assessment (BAHA) program. The program rates watersheds and dams 1–5 and combines them into a global score:
| Watershed | Dam 1 | Dam 2 | Dam 3 | Dam 4 | Dam 5 | +1 severe | +2 severe | +3 severe |
|---|---|---|---|---|---|---|---|---|
| 1 | 0 | 0 | 0 | 0 | 0 | 0 | 0 | 0 |
| 2 | 0 | 0 | 0 | 1 | 2 | 4 | 6 | 8 |
| 3 | 0 | 0 | 2 | 6 | 15 | 30 | 46 | 61 |
| 4 | 0 | 2 | 8 | 26 | 64 | 128 | 192 | 256 |
| 5 | 0 | 5 | 25 | 80 | 195 | 391 | 586 | 781 |
Never use explosives on a beaver dam or culvert plug. In one case a dynamited dam overloaded a 3-ft culvert and more than 300 ft of a 60-ft-high embankment failed, with the water travelling through old permeable fill from a buried timber bridge. After any high water is drawn down, the embankment is least stable for about 12–24 hours, while the confining water is gone but the fill is still saturated and seepage reverses. Beaver ponds are protected fish habitat under the Canadian Fisheries Act; permits are required, and penalties can reach $1,000,000 and imprisonment for individuals.
Figures · click to zoom
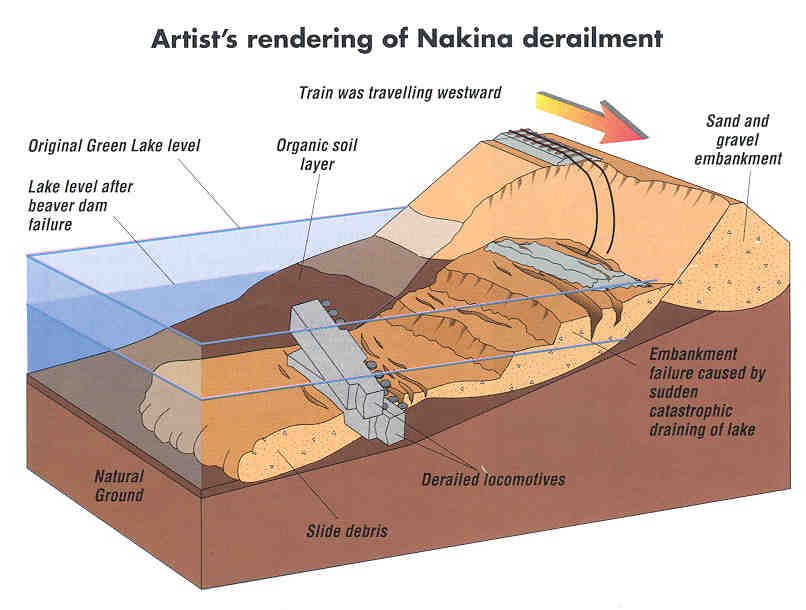
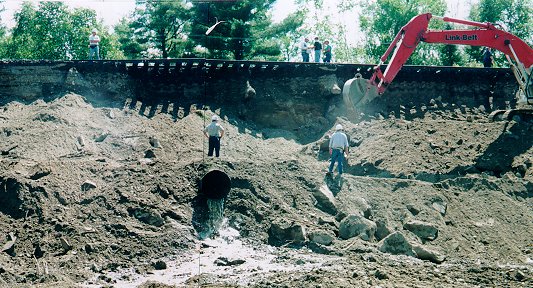
After Geotechnology for Railroaders Program, Module 6.5, Module 7.1, Module 4; Module 6.5 §02–06; Module 7.1 §04, §06. Full reference under Supplemental Sources.
Chapter 1 separates progressive settlement from sudden collapse. The mechanisms below produce sudden collapse. They are the most dangerous for train operations because warning time is short.
| Mechanism | Process | Where to Expect It |
|---|---|---|
| Karst sinkholes | Soil ravels into solution cavities in limestone, dolomite or gypsum until the overlying arch collapses (cover-collapse) or sags (cover-subsidence) | Karst regions; often triggered by water-table changes or concentrated drainage |
| Mine subsidence | Collapse of underground workings producing troughs (sag) or pits | Abandoned coal and mineral mining districts |
| Hydrocollapse | Low-density, dry soils lose their bonding and compress when first wetted | Loess and some arid-region alluvium; triggered by new drainage or leaks |
| Culvert and pipe failure | Backfill lost through corroded or separated barrels leaves voids that collapse | Aging metal culverts; clay tile and masonry drains |
| Decay of buried timber | Rotting of buried trestles and cribbing leaves voids in the fill | Fills built over or around former timber structures |
| Leaking utilities | Water and sewer leaks wash fines into the pipe or away along the trench | Utility crossings (Chapter 3, Section 3.9) |
| Burrowing animals | Burrows provide seepage paths and voids in embankments | Embankments near water; flood-control levee analogs |
Earthquakes act as triggers for several of the mechanisms above, and they also introduce mechanisms of their own: liquefaction of loose saturated granular soils, lateral spreading toward free faces, cyclic softening of soft clays, and seismically induced slope failures and rockfall. Evaluate these using Chapter 14. After a felt earthquake, the railroad's earthquake notification protocol (Chapter 1, Section 1.8) sets the inspection radius and speed restrictions.
Profillidis treats earthquakes in two parts: designing structures, track and subgrade for the regional design acceleration (up to about 0.3 g in his text), and protecting trains during an event. For the second, accelerometer sensors in protected housings along the line report to an alarm center:
These values describe one European system and can be compared with client post-earthquake inspection protocols (Chapter 14).
After Profillidis (2014), §9.17. Full reference under Supplemental Sources.
More than 1,500 seismic events are recorded in Canada each year, with a significant one every two to five years. Energy travels farther through dense eastern Precambrian rock. The 1935 Temiskaming M6.2 earthquake caused an embankment failure more than 220 mi from the epicenter. The 1988 Saguenay M~6.3 event temporarily liquefied a muskeg zone and triggered nine slope failures; derailments were avoided only because the track was closed. In a 2010 event, straight rail was left kinked into S-curves, buckled at ties and disturbed at culverts, damage not visible from a moving train. Post-event inspection must cover track and roadbed, drainage, culverts, retaining walls, tunnels, overpasses, bridges and approaches, adjacent buildings, fiber and utilities, and signals. Response criteria are in Chapter 14.
Figures · click to zoom
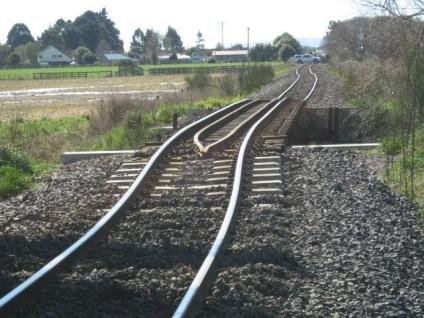
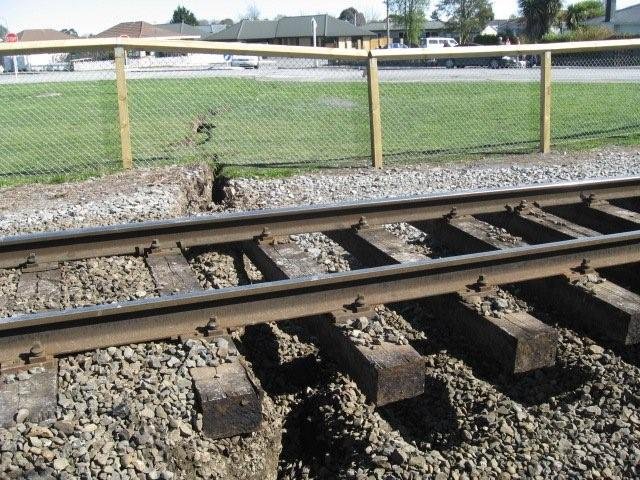
After Geotechnology for Railroaders Program, Module 7.3; §02, §05–06. Full reference under Supplemental Sources.
Most failures are set off by water. Load and human activity come next.
| Trigger | How It Acts | Mechanisms Most Affected |
|---|---|---|
| Intense short-duration rainfall | Surface runoff, erosion, rapid rise of perched water | Debris flow, shallow slides, washout, scour |
| Prolonged rainfall and antecedent moisture | Raises groundwater and pore pressure over days to weeks | Deep-seated slides, subgrade softening, pumping |
| Snowmelt and rain-on-snow | Large water input on saturated or frozen ground | Slides, washouts, thaw weakening |
| Freeze-thaw cycles | Ice wedging in rock; ice lens growth and melt in soil | Rockfall, frost heave, spring pumping |
| Flood and high water | Scour, overtopping, saturation of embankments | Scour, washout, piping |
| Rapid drawdown | Loss of external water support on a saturated slope | Slides of river-bank embankments |
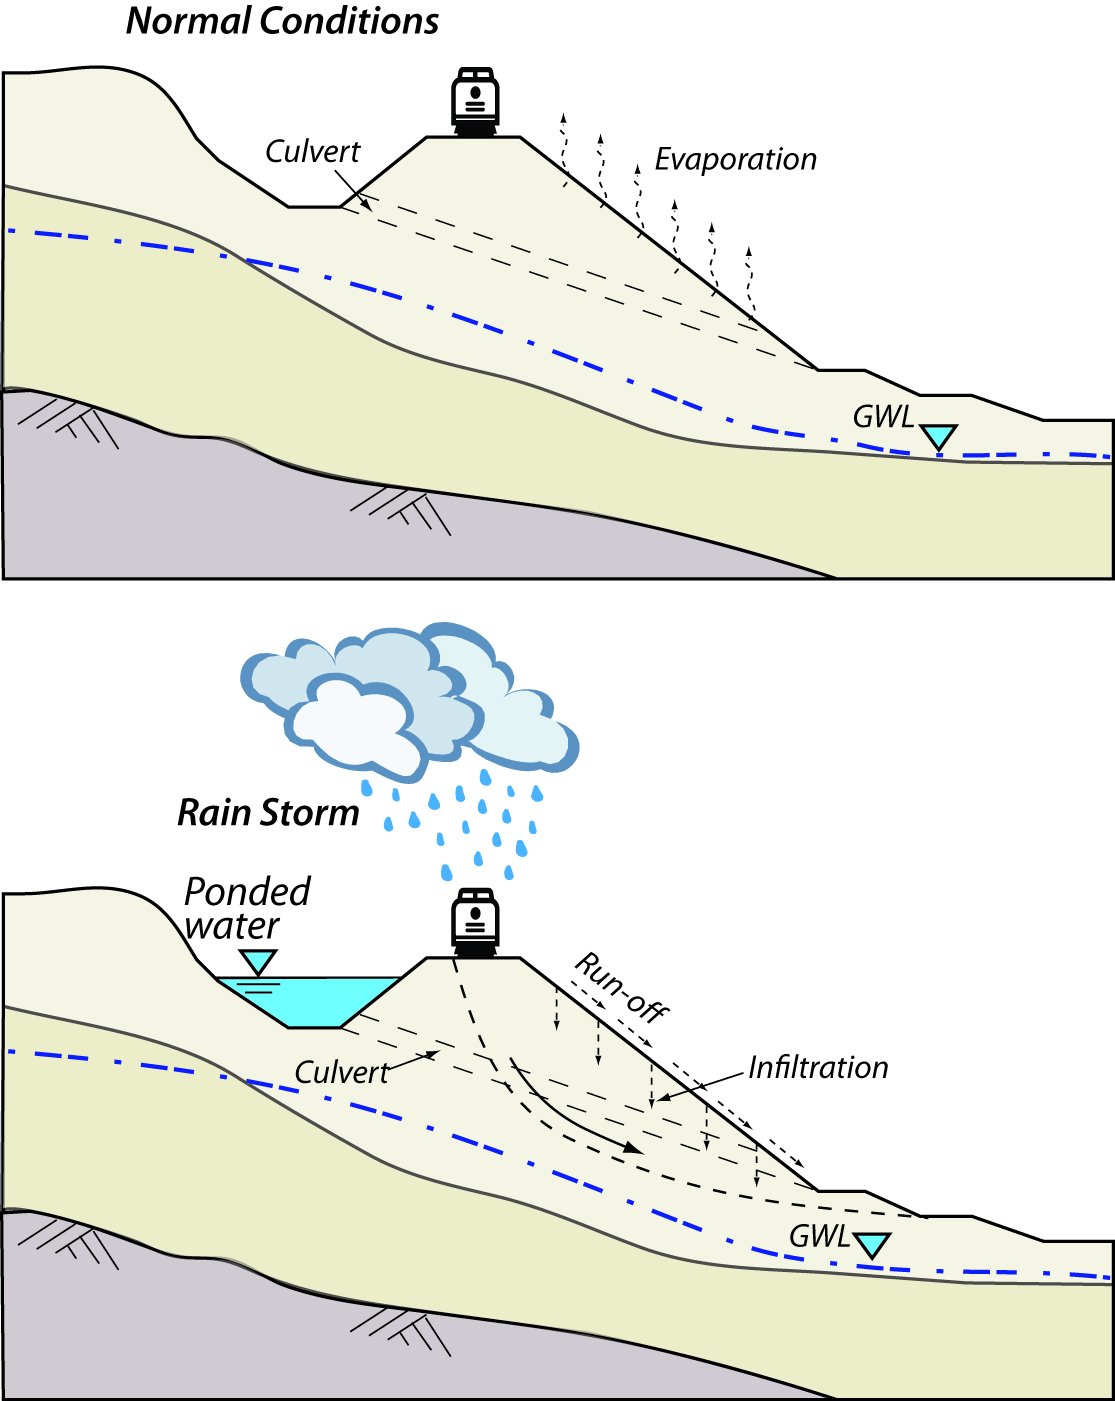
| Blocked drainage | Ponding against embankments; water forced through fill | Piping, slides, subgrade softening |
| Increased load | Heavier axle loads, higher tonnage or speed, new track, stockpiles near crest | Progressive shear, cumulative deformation, slides |
| Construction and maintenance | Toe excavation, ditch cleaning that undercuts slopes, undercutting, vegetation removal, grade raises | Slides, erosion, settlement |
| Earthquake | Cyclic loading and inertial forces | Liquefaction, lateral spread, slides, rockfall |
| Wildfire | Loss of vegetation and water-repellent soils increase runoff for several seasons | Debris flow, erosion |
| Beaver activity | Impounds water against fills; dams fail in storms | Washout, piping |
| Utility leaks and mining | Localized water or loss of support | Sinkholes, collapse, settlement |
Climate trends matter for risk evaluation. Where records show more frequent intense rainfall, return-period assumptions behind existing drainage and past stability evaluations may no longer hold. Note this in the risk evaluation (Chapter 1, Section 1.7) rather than assuming past performance will continue.
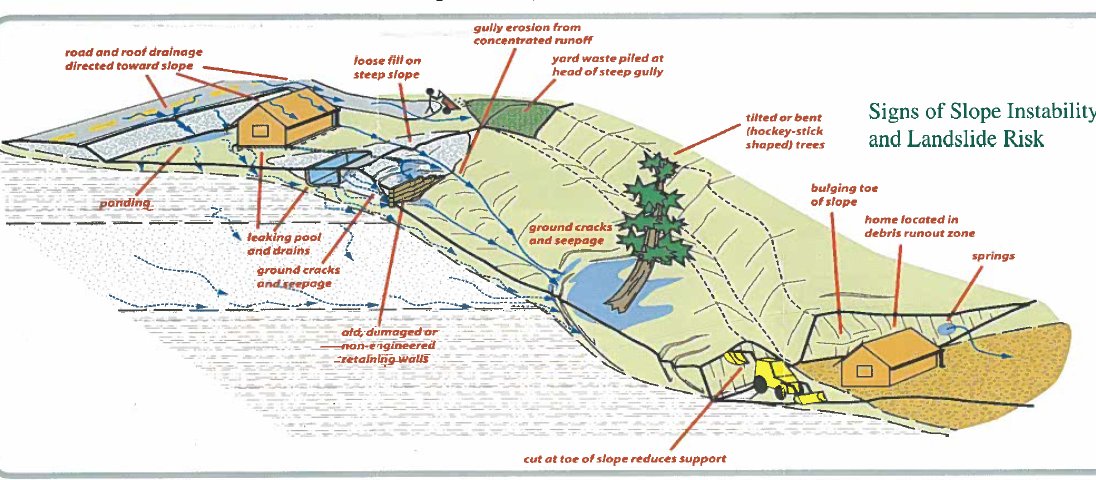
A trigger is an external stimulus that causes a near-immediate landslide or washout by raising stress, reducing strength or removing soil: intense or persistent rain, floods, high stream flow, rapid snowmelt, earthquakes, elevated seepage, water-level change, freeze–thaw and rapid drawdown. Weather is the most common trigger, and antecedent wetness matters as much as the storm. Underlying causes are geological (weak, sensitive, weathered or jointed materials, adverse bedding, permeability contrasts), morphological (toe erosion, piping, crest loading, vegetation loss, thaw) and human (toe excavation, crest loading, reservoir drawdown, deforestation, irrigation, vibration, leaking utilities).
Water weakens slopes in five ways: it adds weight in the voids, is absorbed by clay minerals with loss of strength, dissolves cement between grains, erodes loose material, and becomes trapped under pressure. A failure surface balances driving and resisting mass, and four actions tip it the wrong way: steepening the slope, removing support at the toe, adding mass high on the slope, and allowing bad drainage to continue.
Figures · click to zoom
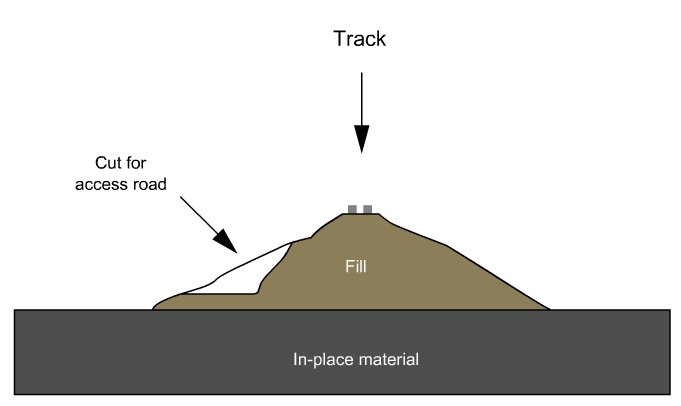
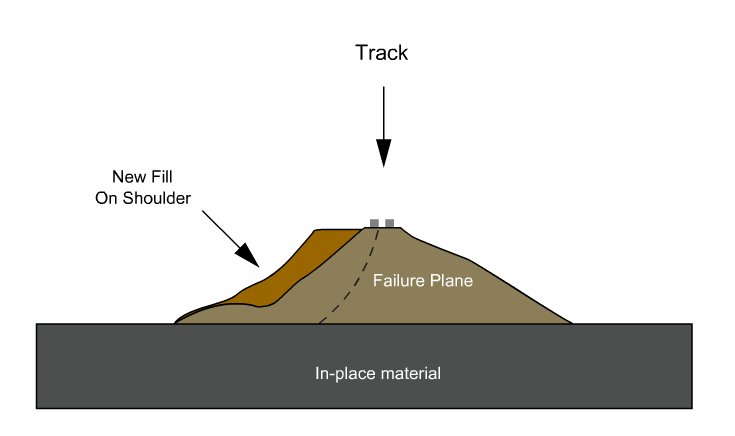
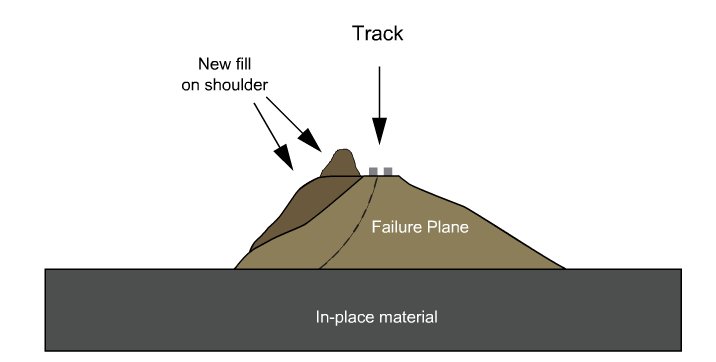
After Geotechnology for Railroaders Program, Module 5, Module 6.4; Module 5 §10, §14; Module 6.4 §07. Full reference under Supplemental Sources.
Because rainfall is the dominant trigger, many railroads tie patrols, speed restrictions and special inspections to precipitation. FRA 49 CFR 213.239 requires special inspections of track after events such as floods and severe storms that may have damaged track structure. A threshold-based protocol makes that requirement predictable.
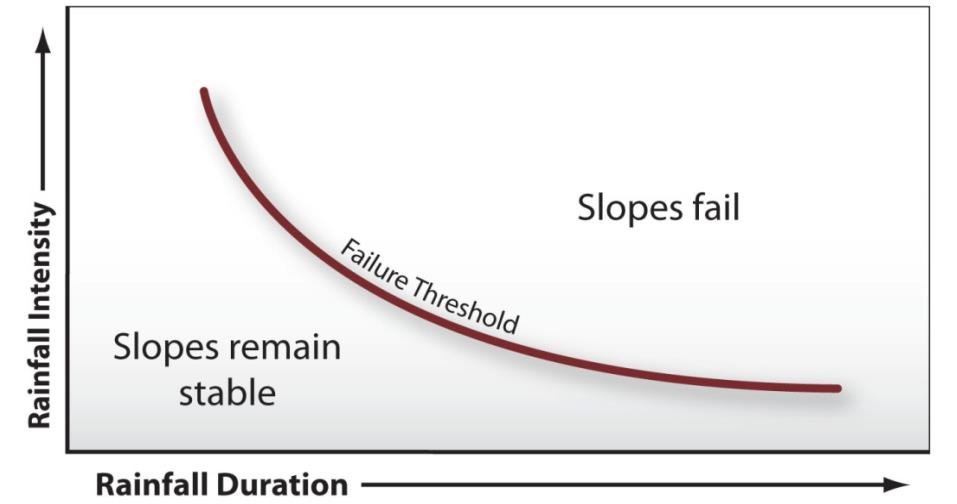
Empirical rainfall thresholds relate the average intensity I needed to trigger shallow landslides and debris flows to the storm duration D. The widely cited global lower-bound threshold of Caine (1980) is:
Equation 4-1: I = 14.82 × D−0.39
where I = rainfall intensity (mm/hr) and D = duration (hr), valid for roughly 10 minutes to 10 days.
A global threshold is only a starting point. Thresholds should be calibrated for each territory from the railroad's own incident history and rain-gauge records. They should also account for antecedent moisture, since the same storm is far more damaging on saturated ground.
Values from these correlations are estimates, not test results. State the equation ID and source when one is used, confirm the soil or rock is within its range, and calibrate against site testing before design.
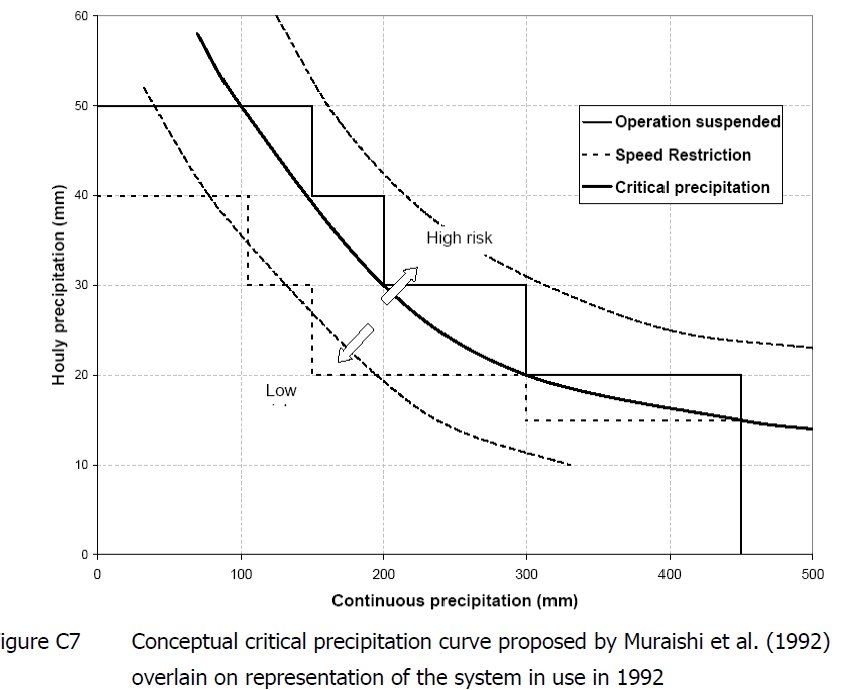
In the course’s Class I practice, the Regional Chief Engineer declares an extreme weather event for a defined subdivision and mile range. The declaration draws on weather-service forecasts and warnings and on reports from train crews and engineering forces, and is passed to Rail Traffic Control, the General Manager and the Regional Senior VP. Restrictions are decided jointly. They weigh the nature of the event, pre-existing ground conditions, topography and incident history, the quality of the weather information, the recency of patrols (a daylight inspection within four hours counts for more than a night inspection twelve hours old), train frequency, and wayside protection such as slide fences and high-water detectors.
The flash-flood trigger used across the Prairies and East is more than 1 in./h totaling over 3 in.; elsewhere, 2 in. in 1 h, 3 in. in 2 h, 4 in. in 4 h or 6 in. in 12 h. A double precipitation index plots short-term intensity against cumulative rainfall to define low-risk, speed-restriction and suspension zones. An antecedent rainfall index plots 2-day against 28-day totals over the history of past landslides at a station. In spring, bearing capacity can drop 30–50%.
Figures · click to zoom
After Geotechnology for Railroaders Program, Module 7.2, Module 7.1, Module 4; Module 7.2 §03–06; Module 7.1 §07. Full reference under Supplemental Sources.
Use this table to move from what the field inspector sees to the most likely mechanisms, and to the investigation that will confirm which one applies.
| Observed Symptom | Likely Mechanisms | Confirming Investigation |
|---|---|---|
| Recurring surface or cross-level defect at one location | Ballast pocket, progressive shear, soft foundation, culvert backfill loss | Trench across track, borings, GPR, geometry-car history |
| Mud at tie ends, fouled shoulders | Mud pumping, ballast fouling | Ballast sampling and fouling index, subgrade plasticity, drainage check |
| Heaved ballast shoulder or ditch side | Progressive shear failure (subgrade squeeze) | Trench, field vane or CPT, moisture content |
| Longitudinal cracks in crest, parallel to track | Rotational or translational slide; embankment spreading | Inclinometers, piezometers, stability analysis |
| Bulging toe, seepage or boils at toe | Slide in progress; internal erosion | Piezometers, seepage mapping, borings at toe |
| Circular depression or hole near track | Sinkhole, pipe or culvert failure, buried timber decay | Probing, geophysics, camera inspection of nearby culverts and utilities |
| Seasonal heave and spring soft spots | Frost heave and thaw weakening | Frost susceptibility testing, groundwater levels |
| Fresh rock in ditch or on track | Rockfall and topple | Rock slope mapping, rockfall hazard rating (Chapter 1) |
| Scour hole or exposed footing at bridge | Local or contraction scour | Underwater inspection, scour evaluation per HEC-18 |
The book defines geometry defects against a theoretical track position averaged over a chord: longitudinal defect (surface or profile), transverse defect (cross-level relative to design cant), horizontal defect (alignment), gauge, and twist (deviation of one of four points on two ties from the plane of the other three, i.e. the change in cross-level per unit length).
Geometric parameters degrade about 5–15 times faster than mechanical ones (rail, ties, fastenings). On a typical UIC group 4 line, geometry is restored after about 40–50 million tons, while rail lasts 500–600 million tons.
Figures · click to zoom
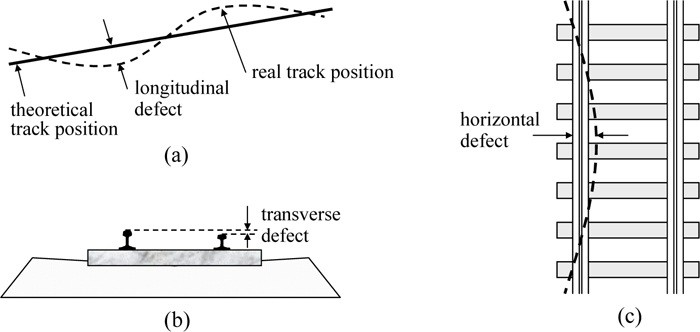
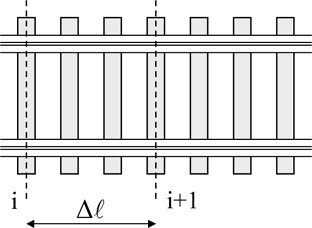
After Profillidis (2014), §16.2–16.4, Figs. 16.3–16.4. Full reference under Supplemental Sources.
Mud on the ballast surface can come from three sources, and each needs a different fix:
Before committing to cleaning or renewal, examine the layers down into the subgrade with trenches, pits or trackbed borings (Chapter 5).
| Cause | Short-term response | Long-term remedy |
|---|---|---|
| Ballast and tie wear or attrition | Add ballast depth; tamp | Renew with more durable ballast |
| Fouled ballast (breakdown or spillage) | Tamp; this delays cleaning only briefly | Clean by undercutting or shoulder cleaning |
| Subgrade attrition and pumping, no subballast | Clean ballast (temporary) | Clean and place a blanket |
| Subgrade attrition, ballast also worn out | — | Renew the ballast and place a blanket |
| Progressive shear failure | No effective short-term fix | Excavate and rebuild to the required granular depth, and restore drainage |
| Ballast pocket holding water | Drain the pocket where possible | Reshape the subgrade or reconstruct; provide an outlet |
Condensed from the book’s failure-condition and remedy table, which is partly illegible in the source scan. Benesch wording.
Clues in the geometry record.
After Selig & Waters (1994), chs. 14 and 15. Full reference under Supplemental Sources.
Values from these correlations are estimates, not test results. State the equation ID and source when one is used, confirm the soil or rock is within its range, and calibrate against site testing before design.
Monitoring converts an unknown mechanism into a measured one. It also provides warning where mitigation cannot be built right away. Instrument selection, installation and reading frequency are covered in Chapter 15.
| Indicator | Instrument or Data Source | Mechanism Monitored |
|---|---|---|
| Subsurface displacement | Inclinometers (ASTM D6230), shape arrays, TDR cable | Slides, creep, spreading |
| Pore pressure | Vibrating-wire piezometers, observation wells | Slides, consolidation, rapid drawdown |
| Settlement | Settlement plates, survey monuments, track geometry-car trends | Consolidation, cumulative deformation, sinkholes |
| Ground surface change | LiDAR change detection, InSAR, UAV photogrammetry | Slides, subsidence, erosion |
| Track bed condition | GPR surveys (Chapter 2, Section 2.9) | Fouling, ballast pockets, wet subgrade |
| Rockfall and slide detection | Slide fences and detector wires tied to signals | Rockfall, debris flow |
| Rainfall and stream stage | Rain gauges, stream gauges, weather services | All water-triggered mechanisms (Section 4.8) |
Recording cars run at fixed intervals: about 3 times a year on main routes, twice a year on intermediate routes and once a year on branch lines. They measure longitudinal, transverse and horizontal defects on a base of about 33 ft and twist on 8–10 ft. At low and medium speeds the absolute (peak and mean) values govern. At higher speeds the standard deviation over 660–980 ft is used as the quality index. Results are ranked by severity and compared with earlier runs and with the limits.
Defects grow quickly until about 2 million tons after maintenance, then slowly and roughly with log T:
Here a1 is the mean settlement at Tr and a0 is the settlement rate per log cycle, 0.079–0.24 in. per decade, depending mainly on subgrade quality (a0/a1 = 0.25–0.70). The standard deviation of longitudinal defects follows the same form with c0 ≈ 0.0039–0.0079 in. per decade. A segment whose fitted a0 or c0 drifts above its neighbors is a candidate for substructure investigation. The sensitive period (about 1–4 months on a UIC group 4 line, 15–40 days on groups 1–3) is when monitoring after a repair matters most.
Figures · click to zoom
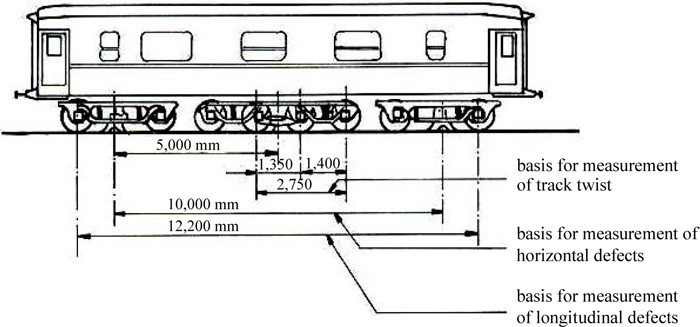

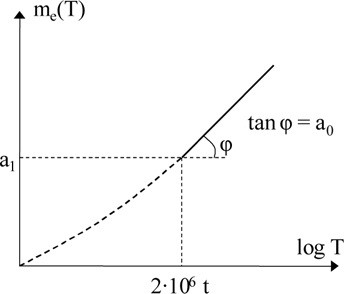
After Profillidis (2014), §16.5, §16.7, §16.10, Eqs. 16.3–16.5, Figs. 16.5, 16.6, 16.8. Full reference under Supplemental Sources.
Warning signs appear in a predictable order: unusual high water on one side, seepage at the downhill toe, tension cracks along the shoulder (often hidden in ballast), a bulging toe and a small sand fan, increasingly dirty or milky seepage, trees leaning in different directions, and finally settlement or cross-level change in the track. Test hidden cracks with a lining bar; it meets little resistance over a fissure. Paint reference marks to see whether cracks widen. Walk down to the base of the fill when checking culverts, because much of this cannot be seen from the track. If movement is large and accelerating, take the track out of service and restore drainage urgently.
Moisture clues: groundwater discharge in depressions, wet zones or salt stains in cut ditches, frost boils, ice at culvert sides, moisture-loving plants (cattails, willows), and sudden lush vegetation on a slope. Report every natural-hazard incident, including rock found in a ditch, on the Natural Hazard Incident Report. It records site and weather (at the time and over the prior 24 h), a rockfall section, a mass-movement and washout section, and consequences (damage, delays, slow orders). The data is used to deploy rock gangs and maintenance crews.
Figures · click to zoom
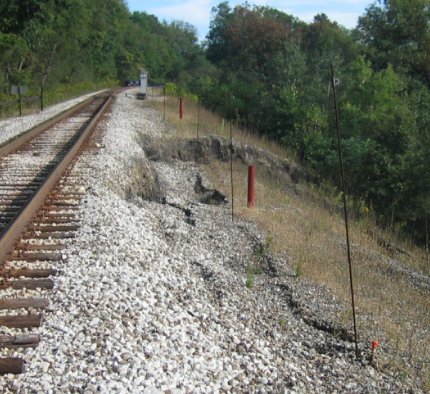
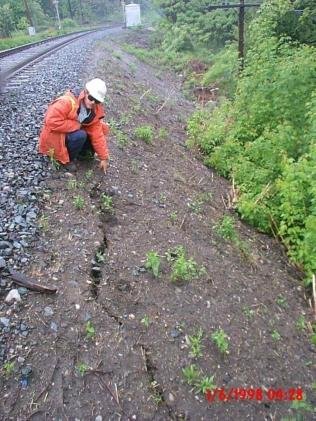
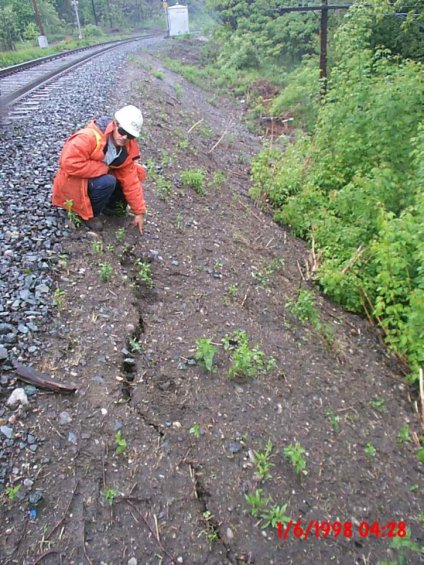
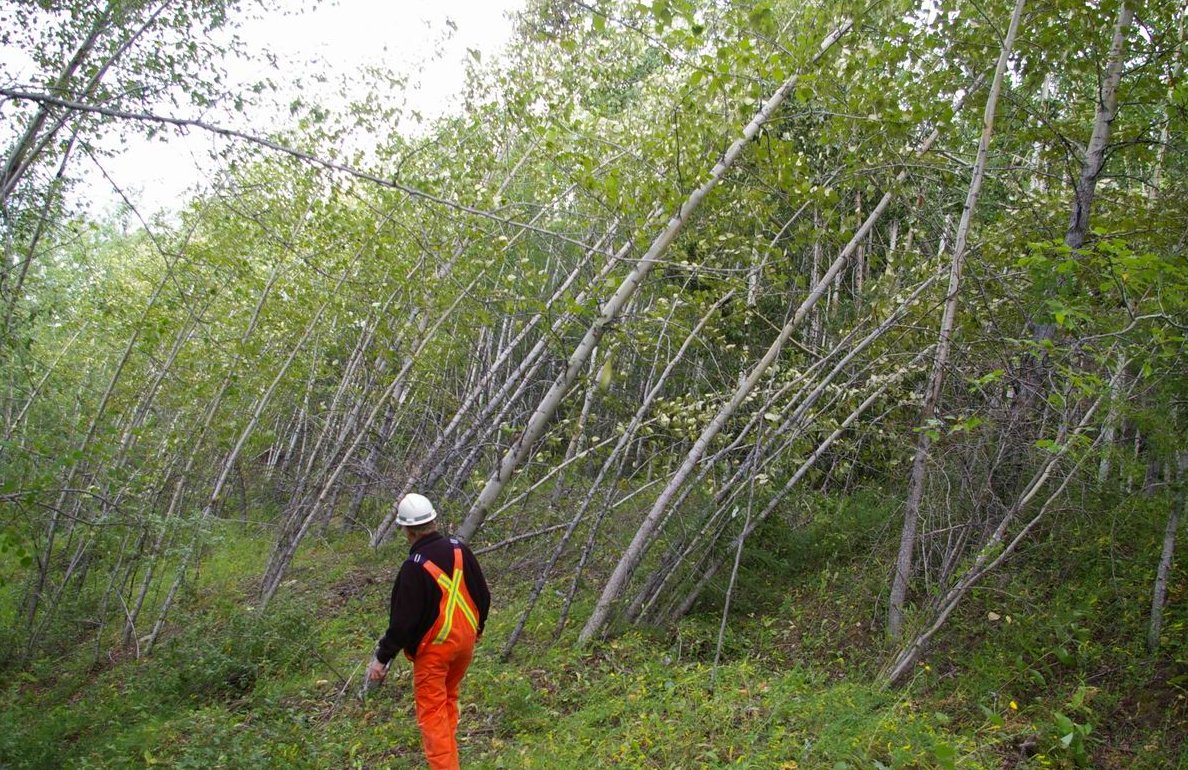
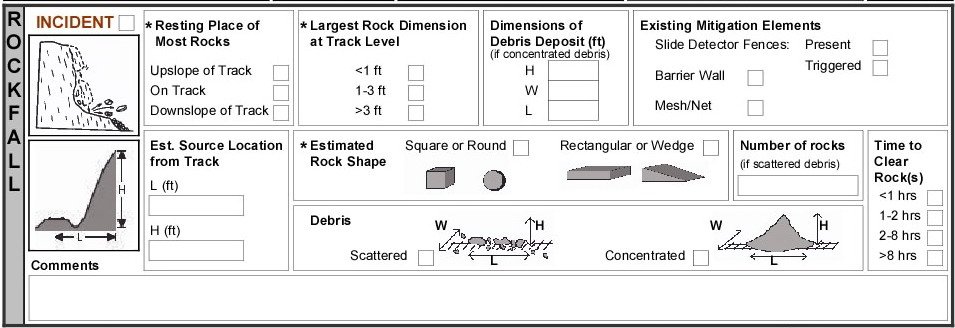
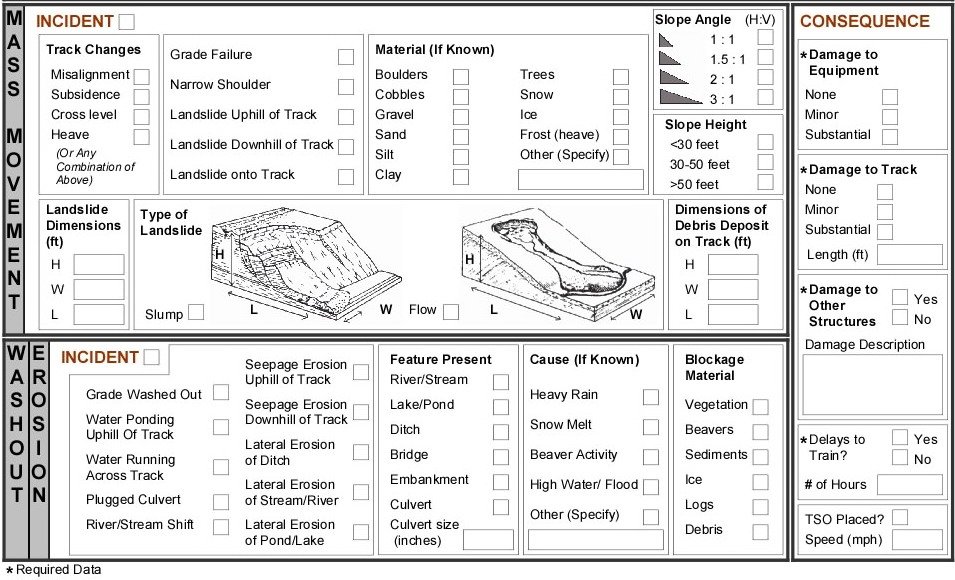
After Geotechnology for Railroaders Program, Module 5, Module 7.1, Module 4, Module 6.4; Module 5 §11; Module 7.1 §05; Module 4 §10; Module 6.4 §05. Full reference under Supplemental Sources.
A responsibility assignment matrix (RAM) makes sure every task has an owner and shows how deeply each person is involved. Tasks are listed as rows and roles as columns. The course uses the RASIC code:
The course example assigns codes for a marketing study (identify market, develop and test the survey, collect and analyze the data, report) across project manager, customer, team members, senior management and support staff.
For railroad work: an early-warning system is only as good as the chain from instrument reading to train movement decision, and that chain crosses organizations. A RASIC matrix agreed before the instruments are installed removes ambiguity at 2 a.m. The illustrative example below must be adapted to each railroad’s own operating rules and authority for slow orders and track removal from service.
Table 4-PM1. Illustrative RASIC matrix for an instrumented slide (adapted from the course method)
| Task | Geotech consultant | Railroad engineering | Track supervisor | Operations / dispatch |
|---|---|---|---|---|
| Set alert and action thresholds | R/S | A | C | I |
| Read and reduce instruments | R/S | I | I | – |
| Threshold exceedance notice | R/S | I | I | I |
| Field inspection of track and slope | S | A | R/S | I |
| Speed restriction or removal from service | C | A | R/S | S |
| Return to normal operation | C | A | R | I |
Keep one Approve per row so that the decision has a single owner. Put named people and phone numbers, with alternates, in the monitoring plan, and review the matrix whenever staff or thresholds change.
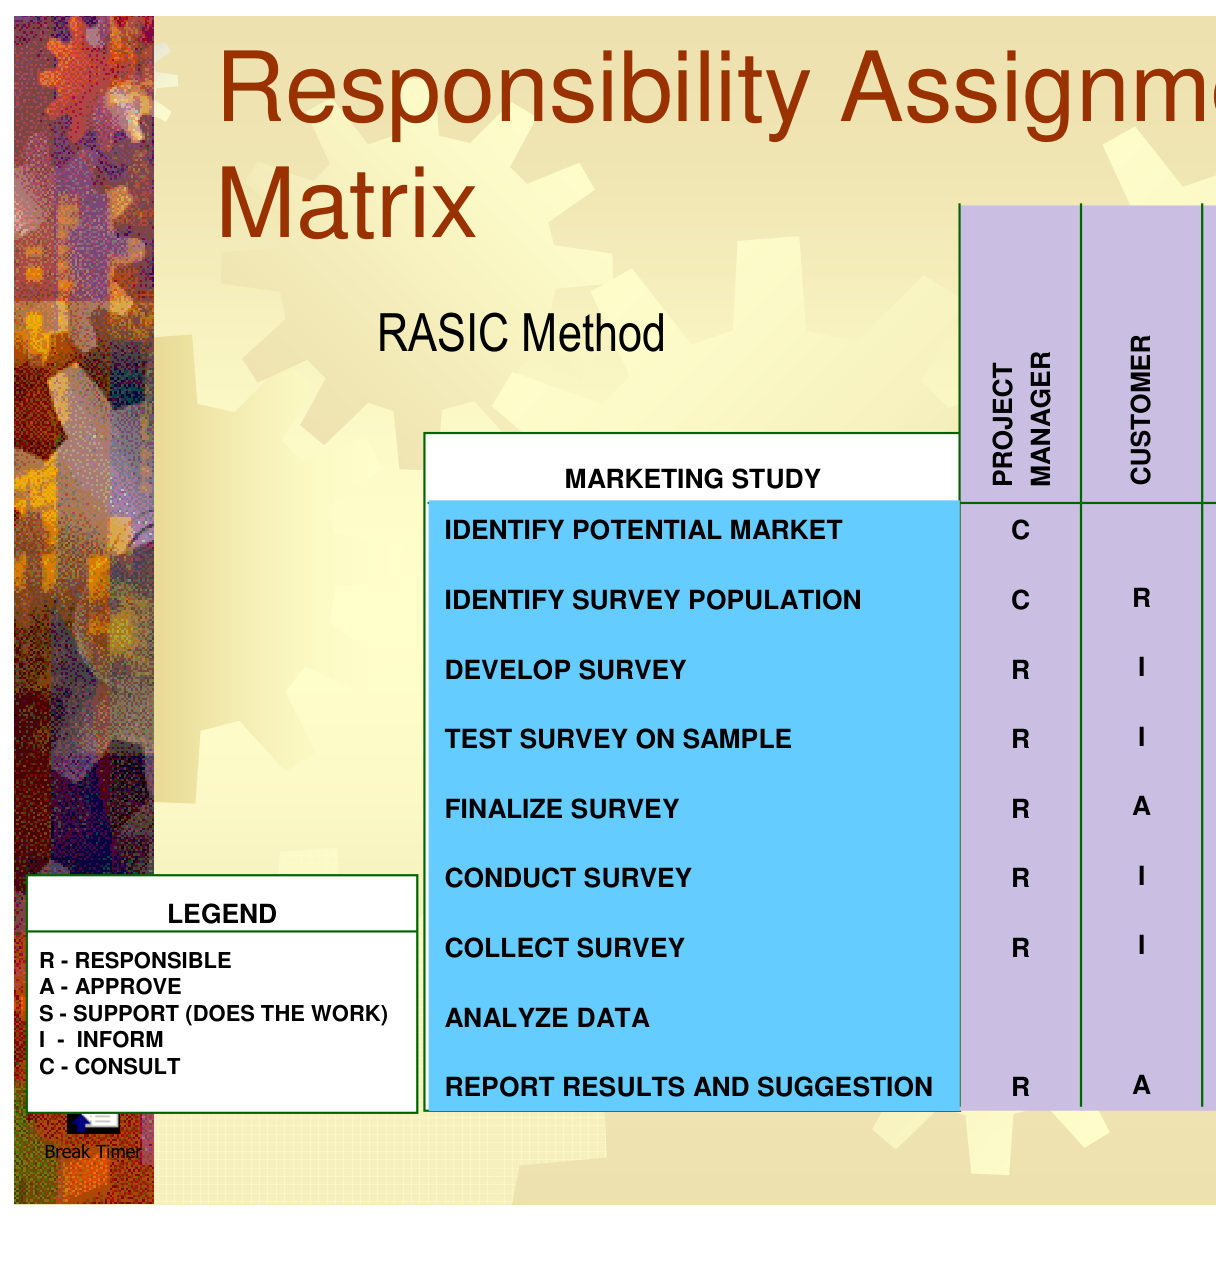
Source: Skill Right (2013). Project Management Tools and Techniques: An Introductory Course in Project Management Foundations [training slides sponsored by Texas Instruments, Inc.; minor modifications by N. Santiago, Spring 2013 version], slides 45–47. Summarized and paraphrased; figures reproduced for internal reference. Full reference under Supplemental Sources.
The two examples below show how a trigger changes the margin of safety at a site.
Project context: A 2H:1V embankment side slope of silty sand fill carries a main track. Shallow sloughing has been reported after heavy rain. Evaluate the change in factor of safety as seepage develops parallel to the slope, using the infinite-slope model (Chapter 13).
Given:
Equation 4-2: FS = [c′ + (γ z cos²β − u) tan φ′] / (γ z sin β cos β), with u = m γw z cos²β
Step 1 — Driving stress: γ z sin β cos β = 120 × 6 × 0.400 = 288 psf
Step 2 — Normal stress: γ z cos²β = 120 × 6 × 0.800 = 576 psf
Step 3 — Factor of safety for three water conditions:
| Condition | m | u (psf) | Resisting stress (psf) | FS |
|---|---|---|---|---|
| Dry (no seepage) | 0 | 0 | 50 + 576 × 0.625 = 410 | 1.42 |
| Half saturated | 0.5 | 150 | 50 + 426 × 0.625 = 316 | 1.10 |
| Fully saturated (water at surface) | 1.0 | 300 | 50 + 276 × 0.625 = 223 | 0.77 |
Conclusion: The slope is marginal even when dry (FS = 1.42, below the 1.5 target). A storm that saturates half the slipping depth brings it close to failure. Full saturation causes failure. The mechanism is shallow translational sliding. The trigger is rainfall infiltration and seepage. Controls that address the mechanism include flattening the slope, adding a drained rock buttress or surface drainage and vegetation. A rainfall-based patrol (Section 4.8) manages exposure until those are built.
Project context: A rain gauge near a debris-flow channel above the track records 2.0 in. of rain in 6 hours. Does the storm exceed the Caine (1980) global threshold?
Step 1 — Average intensity: 2.0 in. / 6 hr = 0.333 in./hr × 25.4 = 8.5 mm/hr
Step 2 — Threshold intensity at D = 6 hr (Equation 4-1): I = 14.82 × 6−0.39 = 14.82 / 2.01 = 7.4 mm/hr
Step 3 — Compare: 8.5 mm/hr > 7.4 mm/hr, so the storm exceeds the global threshold.
Conclusion: Under a protocol calibrated to this threshold, the site would move to its heightened-response level, such as a patrol before the next train or a speed restriction, depending on the site's risk rating. Remember that the global threshold is a lower bound drawn from worldwide data. Calibrate it for the territory before relying on it.
Checklist · Part IV · Failure Mechanisms (Triggers)
| Topic | See Also |
|---|---|
| Hazard classification, risk estimation and control hierarchy | Chapter 1 |
| Subgrade failure modes, fouling index, GPR | Chapter 2 |
| Foundation elements, culverts, bridge approaches | Chapter 3 |
| Groundwater and seepage | Chapter 9 |
| Settlement analysis | Chapter 12 |
| Slope stability analysis | Chapter 13 |
| Seismic hazard and liquefaction | Chapter 14 |
| Instrumentation and monitoring | Chapter 15 |
| Stabilization and ground improvement | Chapters 16, 17; Section 17.16 |
Q1. Classify each as a predisposing condition, preparatory factor or trigger: (a) a sensitive clay deposit; (b) a culvert corroding over 20 years; (c) a 100-year storm; (d) tonnage on the line doubling over a decade.
Answer:
Q2. Using Example 4-1, what saturated fraction m brings the slope to FS = 1.0?
Answer:
Q3. A storm delivers 3.0 in. of rain in 24 hours. Does it exceed the Caine threshold?
Answer:
Q4. Why is diagnosing the mechanism, and not just the trigger, essential before selecting a repair?
Answer:
Values from these correlations are estimates, not test results. State the equation ID and source when one is used, confirm the soil or rock is within its range, and calibrate against site testing before design.
Field case studies by Burt G. Look, from Earthworks: Theory to Practice – Design and Construction (CRC Press/Balkema, 2023), chosen for this chapter’s topics. Each is summarized from the book with its key figures and a closing note on railroad application added by the authors of this manual. Credit for the case material belongs to Look; see item S4 under Supplemental Sources.
Related section: 4.3 Embankment and Slope Failure Mechanisms
Look uses three historical failures to show that a slope’s safety obligations extend beyond the construction boundary:
Most slope instability is smaller and stays on site, costing time and money; but a single 12 in boulder from a cutting can reach a traffic lane or a house 164 ft away.
For railroad work: a track at the toe of mine spoil, a tailings embankment or a steep developed hillside is exposed to a failure that starts on someone else’s property. Section 4.3’s flow-slide mechanisms apply, and these sources belong on the hazard inventory even when they are outside the right-of-way.
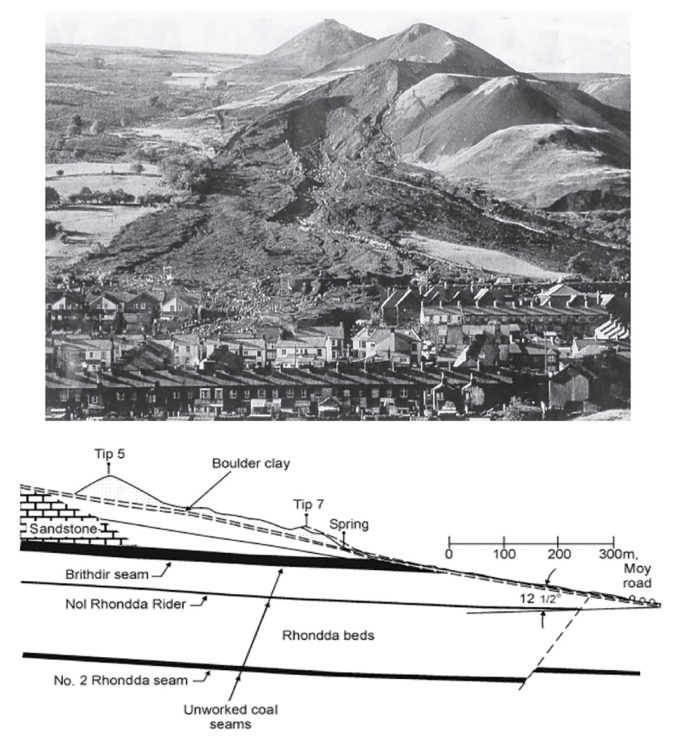
Source: Look, B. G. (2023). Earthworks: Theory to Practice – Design and Construction. CRC Press/Balkema. Case study §3.8, pp. 92. Summarized and paraphrased; figures reproduced for internal reference. Full reference under Supplemental Sources.
Sections on this page marked “After Profillidis (2014)” draw on the document below. Text is summarized or paraphrased; tables are transcribed or reproduced with their original source noted; figures and photos are reproduced from the cited document for internal reference use. Consult the original document before relying on a value for design. Blocks marked “After Selig & Waters (1994)” summarize item S3 for railroad clients; tables are condensed from the book and its figures are not reproduced. The Case Studies section summarizes case studies from item S4 by Burt G. Look; its figures are reproduced from the book for internal reference use, and the closing “For railroad work” note in each case study is added by the authors of this manual. Blocks tagged “Project management” summarize methods, examples and figures from the project-management, estimating and construction-management books listed here, applied to railroad work; the closing “For railroad work” note in each block is added by the authors of this manual.
Authors: Daniel P. Colwell and Mario Ruel. This part was written and compiled by Daniel P. Colwell and Mario Ruel for Railway Ground Hazard Risk Management.
Technical content is drawn from the published sources below, and credit for that material belongs to their authors and publishers. Tables, equations and figures taken from a specific source are also cited where they appear.