
Geotechnical engineering libraryContact
Primary Reference: USACE EM 1110-1-1804, Geotechnical Investigations, 1 January 2001, Chapters 8–9 Railroad Standards: AREMA MRE Chapter 1 & 8; CSXT Engineering Standards; NSR Engineering Standards Manual §3.3; G&W Engineering Bulletins; UPRR Engineering Instruction Manual §GT-101; BNSF Engineering Instructions; CPKC Track Standards; Amtrak Engineering Standards; CN Engineering Standards
Apps on dirtbert.com that support this chapter. Each one runs in a web browser on a desktop or a phone, with nothing to install. How to use the apps (I.3).
NANCY pages ask you to accept the Use and Disclaimers once in each browser.
Borings and sampling form the physical backbone of every geotechnical investigation we conduct for railroad clients. Whether we are planning a simple passing siding for a G&W short line, upgrading a high-density mainline corridor for CSXT or BNSF, or characterizing a soft-ground embankment for Amtrak's Northeast Corridor, the quality of subsurface data we deliver is only as good as the drilling methods, sampling protocols, and documentation we employ in the field. This chapter covers the full spectrum of boring techniques used in railroad geotechnical practice — hollow-stem auger, mud rotary, air rotary, and diamond core drilling — alongside standard sampling methods including the Split-Spoon Sampler (SPT), Shelby tube, piston sampler, and rock coring. Emphasis is placed on the complete SPT correction chain required for quantitative analysis, the preservation of sample quality for laboratory testing, and the documentation standards expected by Class I carriers and regional railroads alike. Worked calculation examples, a fully annotated boring log, and a representative laboratory data table are provided. The chapter closes with a field operations checklist, practical recommendations developed from active railroad project experience, and five practice questions with complete answers.
For railroad clients, a boring log is not merely a field record — it is a legal and contractual document. CSXT's Engineering Standards require that all subsurface investigation records be submitted in a client-approved format and retained for the life of the facility. NSR's Engineering Standards Manual §3.3 specifies minimum data content for boring logs used to support bridge and culvert foundation design. UPRR's Engineering Instruction Manual §GT-101 establishes chain-of-custody requirements for soil samples recovered from UPRR right-of-way. When our boring logs and sample records are weak, inaccurate, or incomplete, we expose both the client and our firm to design liability, change order disputes, and construction failures.
AREMA's Manual for Railway Engineering (MRE), Chapter 1, establishes the professional standard of care for geotechnical investigations supporting railroad infrastructure. Chapter 13 of the same manual provides specific guidance on the load environments that our subsurface data must characterize — Cooper E-80 live loading, dynamic load factors (DLF) ranging from 1.3 to 1.5 depending on operating speed and equipment, and the influence depths associated with standard track and structure configurations. Our boring programs must be designed with these loading demands explicitly in mind, a principle reinforced by BNSF Engineering Instructions, which require that boring depth justification be included in all geotechnical investigation reports submitted for BNSF bridge and embankment projects.
CN Engineering Standards extend this principle to Canadian operations: boring logs submitted for CN projects on shared corridors must conform to ASTM D 5434 minimum data requirements and be accompanied by a chain-of-custody record for all SPT and undisturbed samples. CPKC Track Standards similarly require that boring logs for track subgrade investigations include water content measurements at every sample interval and a narrative description of drilling fluid returns during mud rotary operations.
Our commitment to boring quality is therefore both a technical and a business imperative. A well-executed boring program, thoroughly documented and delivered in the client's preferred format, is a direct competitive advantage in railroad geotechnical practice.
The UIC subgrade classes (Chapter 2, §2.4) are assigned from a short list of parameters. If track-subgrade borings are to support that classification, or a comparison with it, the sampling plan must recover them through the top 6.5 ft of subgrade, the depth Profillidis gives as mechanically affected by train loading:
After Profillidis (2014), §7.2, §9.5, Table 9.2. Full reference under Supplemental Sources.
Reference graphics
Reference graphics · click to zoom
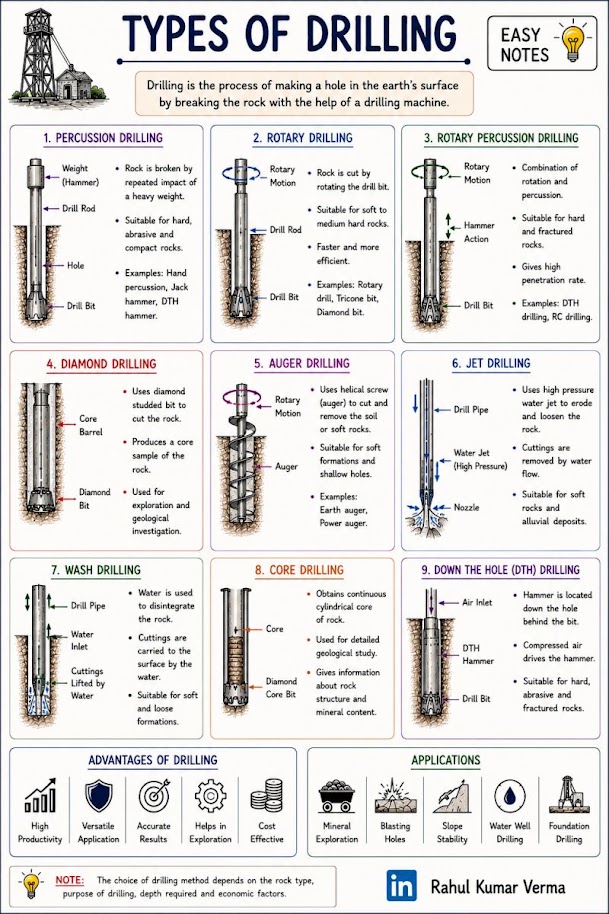
Hollow-stem auger drilling is the preferred method for most railroad embankment, subgrade, and shallow foundation investigations where soil conditions permit. HSA allows continuous sample recovery through the auger stem without removing the drill string, minimizing borehole disturbance and reducing the risk of borehole collapse in granular soils above the water table.
Applicable client contexts:
Limitations: HSA is not appropriate in running sands below the water table (where heave into the auger stem is common), in hard or cemented soils, in rock, or where boring depths exceed approximately 100–120 ft. In these conditions, mud rotary or air rotary methods are substituted.
Equipment specifications:
Mud rotary drilling uses a pressurized fluid — typically a bentonite-water slurry — to cool the bit, carry cuttings to the surface, and stabilize the borehole wall. It is the preferred method for deep investigations (greater than approximately 100 ft), for offshore or waterway bridge site investigations, and for any condition where borehole stability cannot be maintained with HSA.
Applicable client contexts:
Critical operational note for railroad right-of-way: All drilling fluid returns must be captured and removed from the ROW. Drilling mud discharged onto active track subgrade is a contract violation under CSXT Engineering Standards and BNSF Engineering Instructions, and may result in immediate suspension of field operations and financial penalties. We require closed-loop mud pits or portable fluid containment systems on all mud rotary jobs conducted within 50 ft of active track.
Air rotary drilling uses compressed air (and in some cases air-foam mixtures) to circulate cuttings and cool the bit. It is the preferred method in rock or very hard soils where drilling fluid is impractical, and is commonly used to advance through casing in overburden before transitioning to diamond core in the rock zone.
Applicable client contexts:
Diamond core drilling recovers continuous cylindrical cores of intact rock for geomechanical characterization. Core drilling is required for any railroad structure with rock-socketed drilled shaft foundations, for tunnel portal and cut investigations, and for any project where bearing on rock or side resistance in rock is a foundation design parameter.
Core barrel sizes used in railroad practice:
| Size | OD (in.) | Core Diameter (in.) | Typical Use |
|---|---|---|---|
| NQ | 2.98 | 1.88 | Deep exploration; limited recovery in fractured rock |
| HQ | 3.78 | 2.50 | Standard size for most railroad bridge foundations |
| PQ | 4.83 | 3.35 | Large-diameter cores; preferred by Amtrak ES for tunnel and major structure investigations |
UPRR EIM §GT-101 requires HQ-size core or larger for all UPRR bridge foundation investigations where drilled shafts are anticipated. Amtrak Engineering Standards specify PQ core for all rock investigations within the NEC improvement program where post-tensioned foundation systems are under evaluation. CPKC Track Standards accept NQ core for preliminary exploration borings but require HQ core for final design borings supporting bridge and culvert replacement projects.
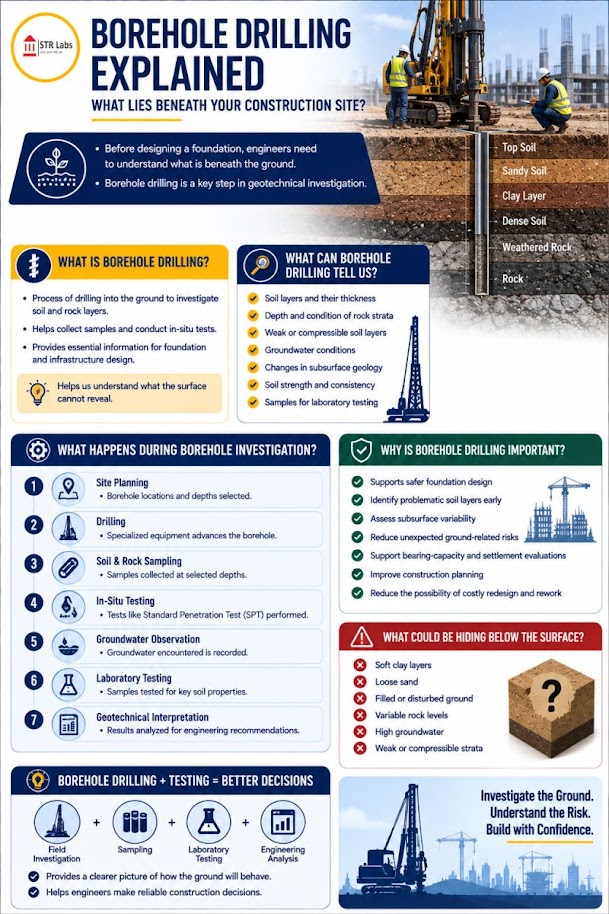
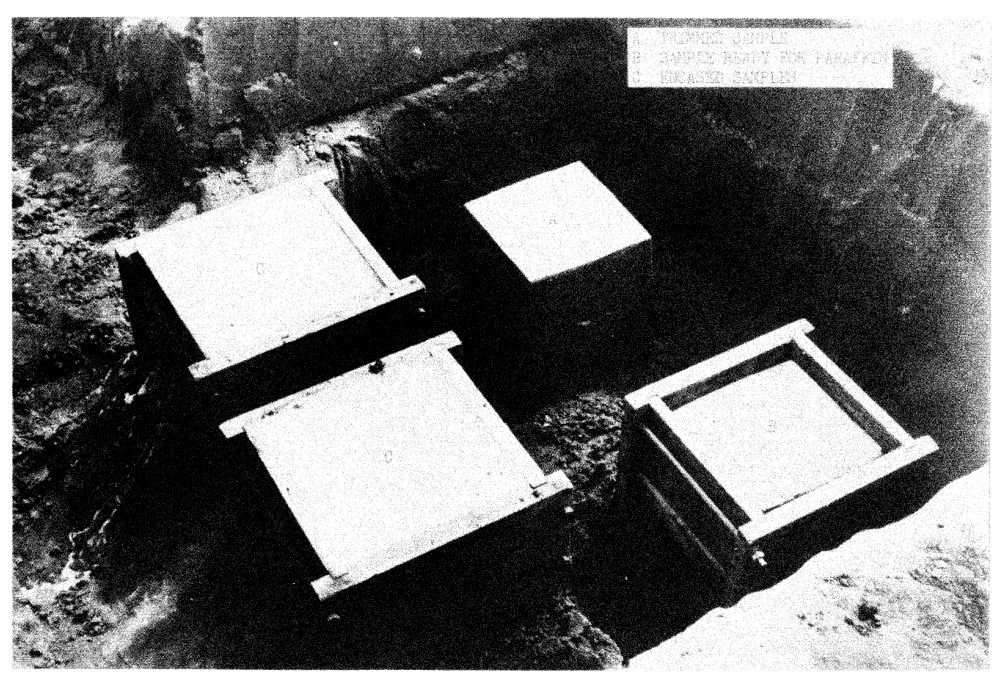
Shallow subgrade samples are taken with shovels, backhoes or hand augers; hand-auger depth is limited by how easily the auger can be pulled, so a powered auger sometimes advances the hole. Deep embankment sampling uses a drilling contractor: split-spoon SPT (ASTM D1586; 2-in. sampler driven 18 in. by a 140-lb hammer falling 30 in.) and Shelby tubes (ASTM D1587; 3-in. × 30-in. thin-wall tube pushed hydraulically). For mud spots and soft track, a hand-dug trench across the shoulder is often the fastest way to see the layering, the water and the failure zone. At Redditt Sub Mile 218.78, test pits confirmed subgrade conditions before the toe berm and cross trenches were designed.
Figures · click to zoom
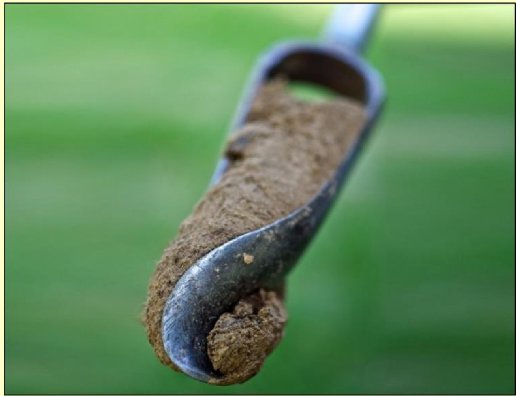
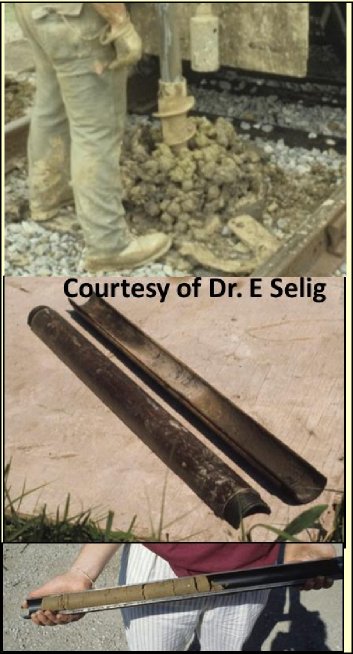
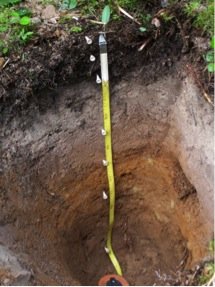
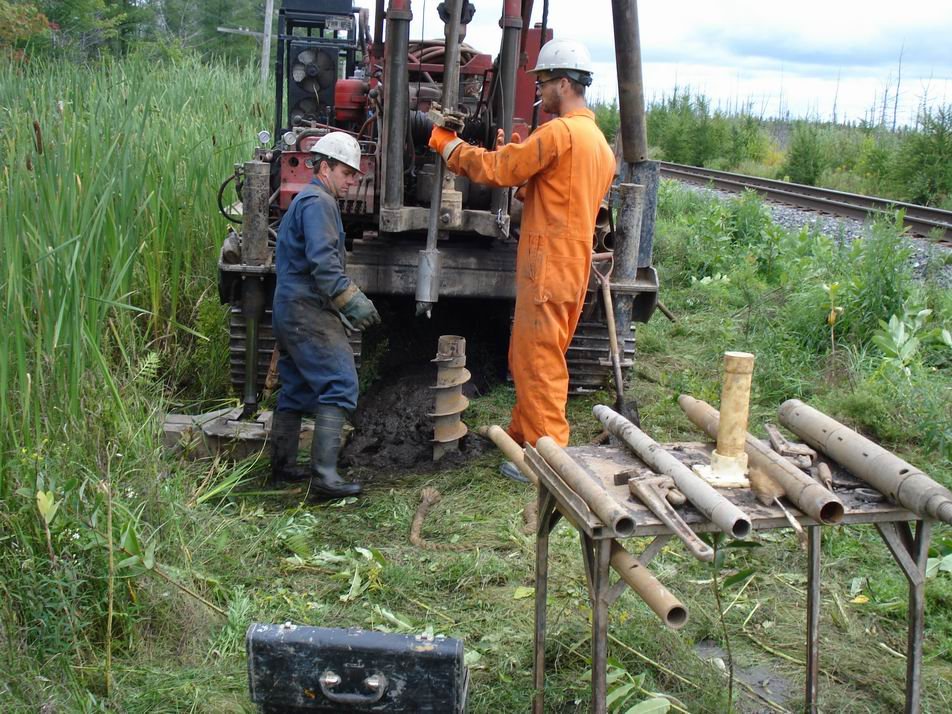
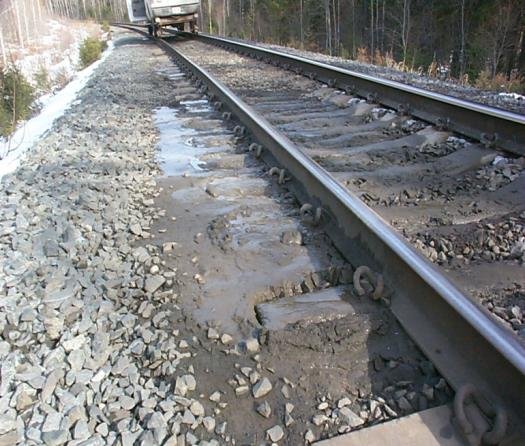
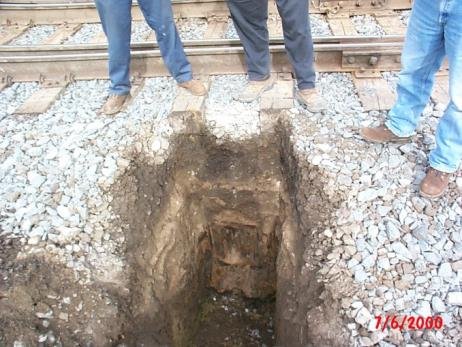
After Geotechnology for Railroaders Program, Module 2, Module 3, Module 6.2; Module 2 §10; Module 3 §11; Module 6.2 §02. Full reference under Supplemental Sources.
Case study: 6.14.1 Auger versus core: when crushed rock is logged as soil (Look 2023), in §6.14 Case Studies.
The Standard Penetration Test is the single most important field test in railroad geotechnical practice. Nearly every design parameter used in embankment stability, foundation bearing capacity, settlement, and liquefaction analysis for our railroad clients is either directly derived from SPT N-values or calibrated against them. Executing the SPT correctly — and applying the complete correction chain before using N-values in analysis — is a non-negotiable quality standard.
Procedure:
Refusal: If 50 blows are required for less than 6 in. of penetration, the test is terminated and recorded as refusal at the applicable penetration depth.
Reference graphics
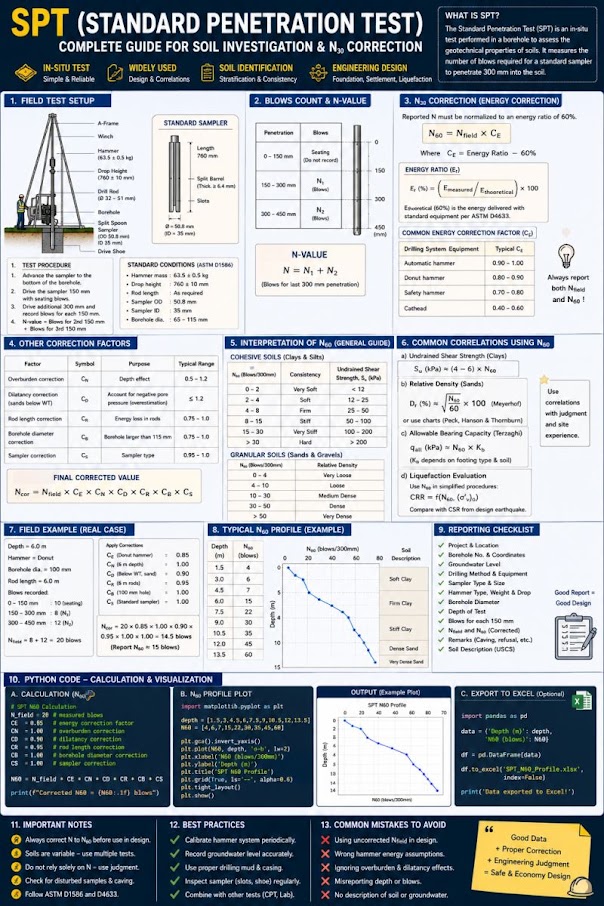
The raw SPT N-value is meaningless for quantitative analysis without correction to a standard energy level of 60% of the theoretical free-fall energy. The corrected value, designated N₆₀, is calculated as:
Where:
CSXT Engineering Standards and BNSF Engineering Instructions both require that energy measurements be performed and reported for each SPT rig used on Class I railroad projects. We conduct per-rig energy calibration using a Pile Driving Analyzer (PDA) or equivalent instrumented anvil at the start of each field mobilization and report measured E_m values in the investigation report.
For liquefaction and relative density analyses, N₆₀ is further corrected to a reference overburden stress of 1 ton per square foot (1 tsf = 2,000 psf) to yield (N₁)₆₀:
Where:
Note: C_N is capped at 2.0 to prevent unrealistically high corrections at shallow depth (typically less than approximately 5 ft below the water table).
| Material | N₆₀ (blows/ft) | Relative Density / Consistency |
|---|---|---|
| Sand | 0–4 | Very Loose |
| Sand | 4–10 | Loose |
| Sand | 10–30 | Medium Dense |
| Sand | 30–50 | Dense |
| Sand | > 50 | Very Dense / Refusal |
| Clay | 0–2 | Very Soft |
| Clay | 2–4 | Soft |
| Clay | 4–8 | Medium Stiff |
| Clay | 8–15 | Stiff |
| Clay | 15–30 | Very Stiff |
| Clay | > 30 | Hard |
Reference graphics
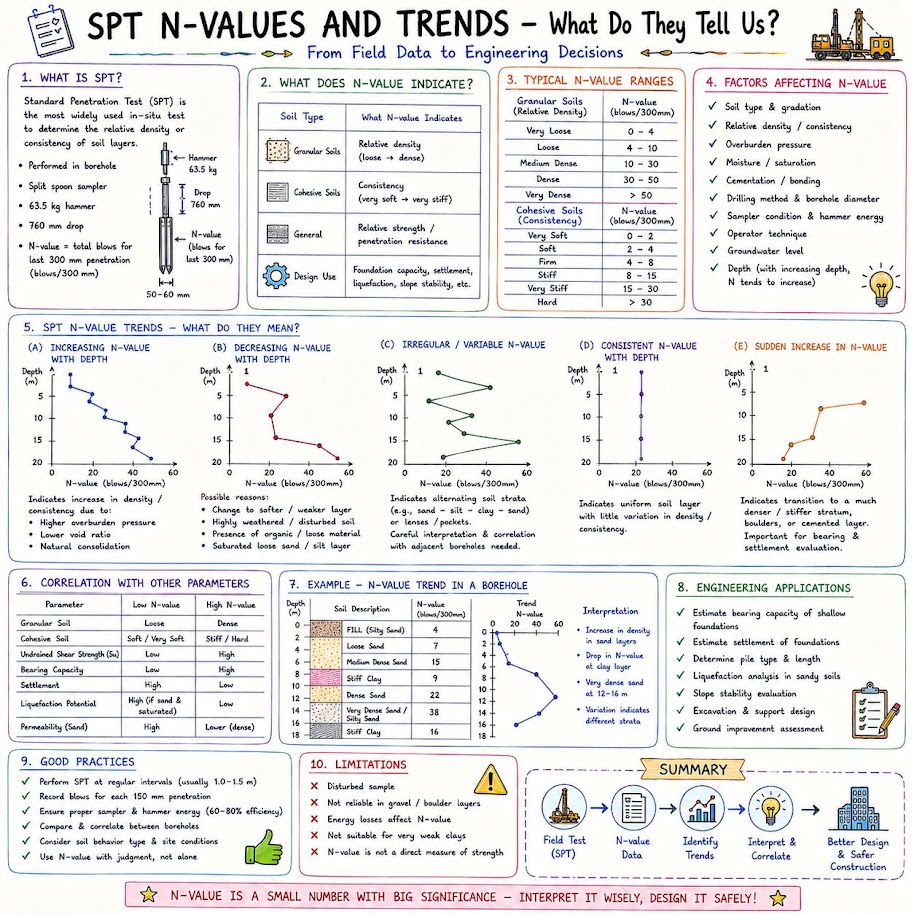
Energy and rod corrections cannot fix a badly run test. GEC 5 (after Kulhawy and Mayne, 1990) lists the field causes and which way they push N:
Table 6-S3. Factors affecting SPT results
| Cause | Effect | Influence on N |
|---|---|---|
| Inadequate cleaning of hole | Test not in original soil; trapped soil compressed in sampler | Increases |
| Water head not maintained in borehole | Bottom of hole becomes quick | Decreases |
| Careless measure of drop | Energy varies, usually low | Increases |
| Hammer weight inaccurate | Energy varies 5–7% commonly | Either |
| Hammer strikes collar eccentrically | Energy reduced | Increases |
| No free fall (stiff rope, ungreased sheave, > 2 turns on cathead) | Energy reduced | Increases |
| Sampler driven above bottom of casing | Driven in disturbed, densified soil | Increases greatly |
| Non-standard sampler | Correlations invalid | Either |
| Coarse gravel or cobbles | Sampler plugged or impeded | Increases |
| Bent drill rods | Energy transfer inhibited | Increases |
Note that most errors increase N — i.e., they are unconservative. GEC 5 also notes that Skempton’s tabulated energy ratios (donut 0.5–1.0, safety 0.7–1.2, automatic 0.8–1.5 as CE = ER/60) are guidance only; measure ER per ASTM D4633.
Source: Sabatini, P. J. et al. (2002). Evaluation of Soil and Rock Properties. Geotechnical Engineering Circular No. 5, FHWA-IF-02-034
Case study: 6.14.2 SPT field values: counting error and three rigs on one site (Look 2023), in §6.14 Case Studies.
Reference graphics
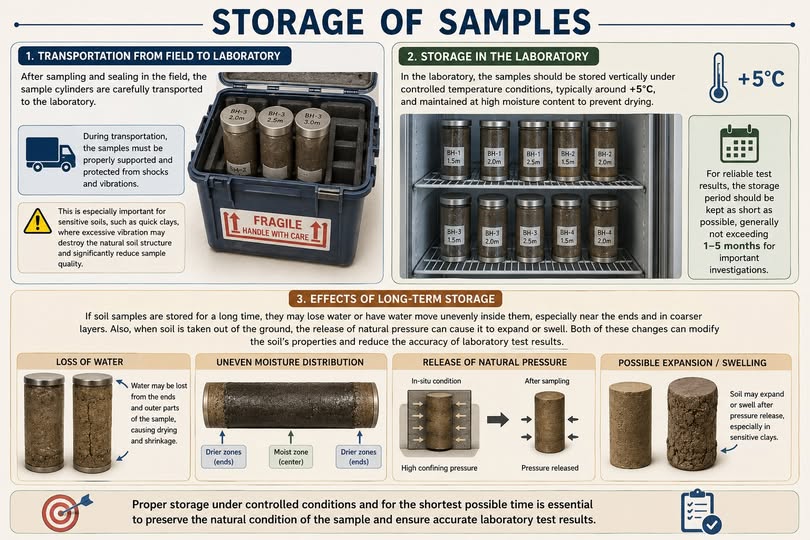
Thin-walled Shelby tube samples are the standard method for recovering nominally undisturbed specimens of soft to medium stiff cohesive soils for consolidation, triaxial, and direct shear testing. The degree of sample disturbance is quantified by the Area Ratio (AR):
Where:
For a standard 3-in. OD Shelby tube with 2.875-in. ID:
ASTM D 1587 requires AR ≤ 10% for thin-walled tubes to be considered acceptable for undisturbed sampling. Our standard 3-in. tubes meet this requirement.
Sample Quality Designation (SQD) per Lunne et al. (1997), based on the ratio of void ratio change (Δe/e₀) measured in the consolidation test:
| Δe/e₀ | Sample Quality |
|---|---|
| < 0.04 | Excellent to Good |
| 0.04–0.07 | Good to Fair |
| 0.07–0.14 | Fair to Poor |
| > 0.14 | Poor to Very Poor |
NSR ESM §3.3 requires that SQD be reported for all Shelby tube samples used in consolidation analysis for bridge approach embankment and culvert replacement projects. Amtrak Engineering Standards require piston sampling rather than push-tube sampling for all soft clay specimens intended for undrained shear strength determination on NEC improvement projects — a standard we accommodate by specifying fixed-piston samplers in Amtrak scopes of work.
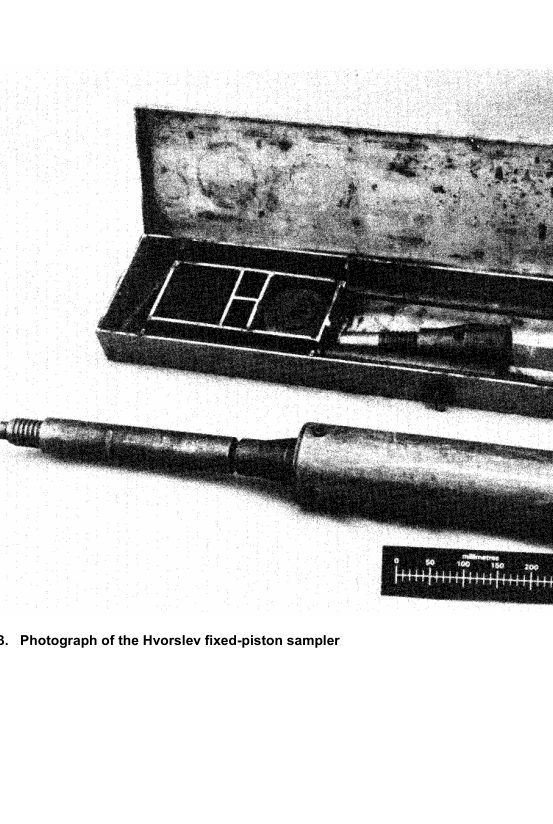
The fixed-piston sampler uses a piston held stationary at the base of the borehole while the sample tube is advanced by hydraulic push, creating a partial vacuum that retains the sample and prevents water entry. Piston samples typically have lower disturbance than conventional push tubes and are preferred by Amtrak ES and CN Engineering Standards for marine and lacustrine soft clay investigations where sample quality is paramount.
GEC 5 (Table 47) flags soils and soft rocks where conventional SPT and tube sampling give misleading results. The ones that show up most often on railroad corridors:
| Material | Sampling difficulty | Engineering concern |
|---|---|---|
| Colluvium and talus | Thin weak lenses; rock fragments prevent sampling; boulders preclude drilling | Thin weak layer and water at the colluvium/rock contact control slope stability; talus may sit at FS ≈ 1. Use test pits, trenches, and surface-wave geophysics for talus thickness. |
| Shale, claystone and other degradable rock | Rock-like in place, needs coring; drilling water starts degradation | Rockfill or cut faces degrade on wetting; slope stability decreases progressively. |
| Cemented sands | High blow counts / refusal look like dense sand; coring water may dissolve binder | Brittle; collapse if the cement is soluble; long-term strength may drop to uncemented sand. |
| Sensitive (quick) clays | Metastable structure makes undisturbed sampling difficult; may need foil or block sampler | Can fail with little or no warning. |
For these materials, plan test pits or block samples, triple-tube coring, or in-situ tests (Chapter 7) rather than relying on SPT and Shelby tubes.
Source: Sabatini, P. J. et al. (2002). Evaluation of Soil and Rock Properties. Geotechnical Engineering Circular No. 5, FHWA-IF-02-034
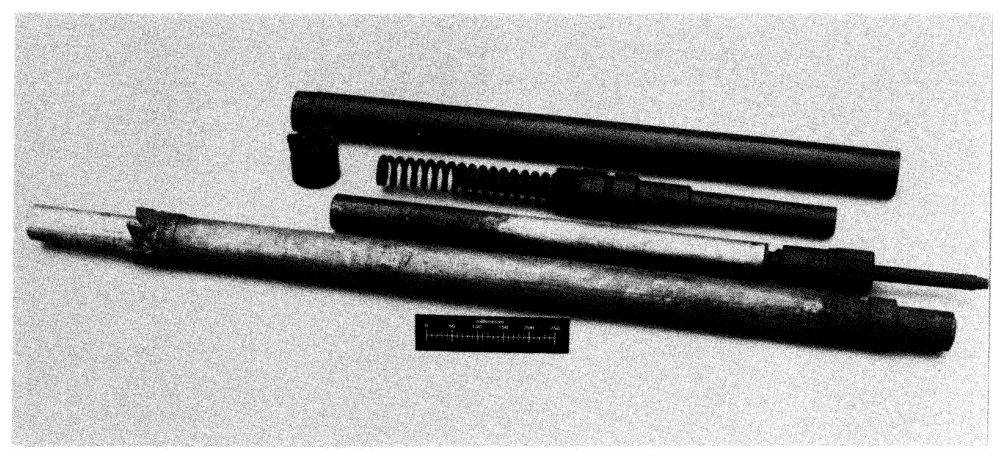
Total Core Recovery (TCR) is the length of core recovered expressed as a percentage of the length drilled:
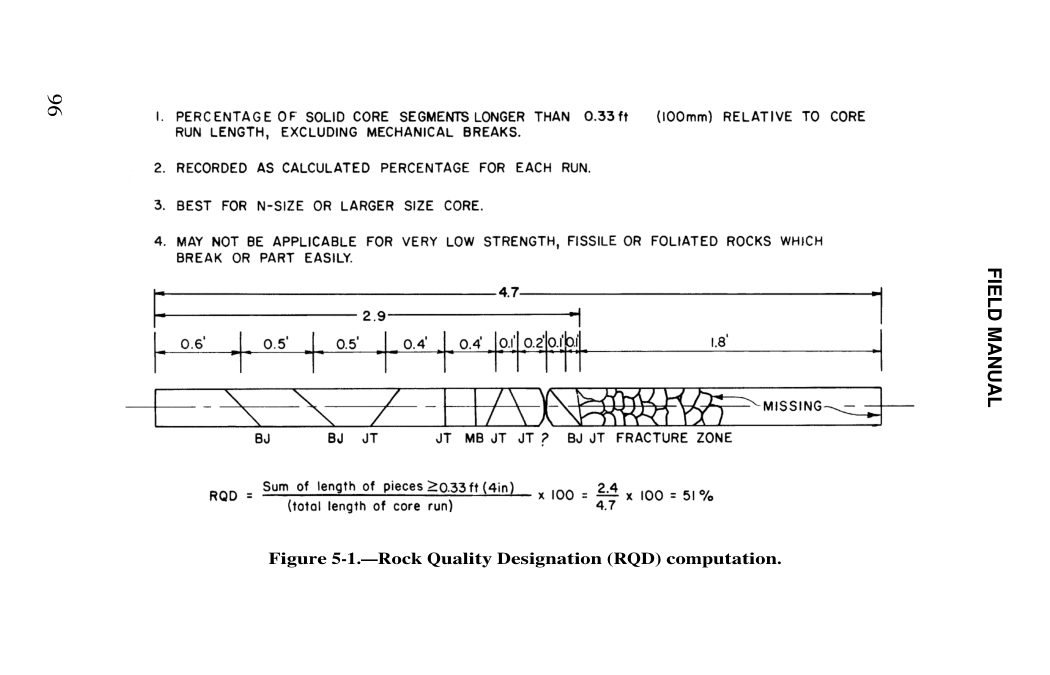
RQD quantifies the degree of fracturing in a rock mass. It is defined as the percentage of a core run consisting of intact pieces 4 inches or longer in length:
| RQD (%) | Rock Quality |
|---|---|
| 0–25 | Very Poor |
| 25–50 | Poor |
| 50–75 | Fair |
| 75–90 | Good |
| 90–100 | Excellent |
UPRR EIM §GT-101 requires that RQD be measured on every core run for UPRR bridge investigations and reported on the boring log alongside TCR, hardness (field estimate), and visual rock description. BNSF Engineering Instructions additionally require that all core boxes be photographed before and after geologist review, with photos submitted as part of the boring data package.
Reference graphics
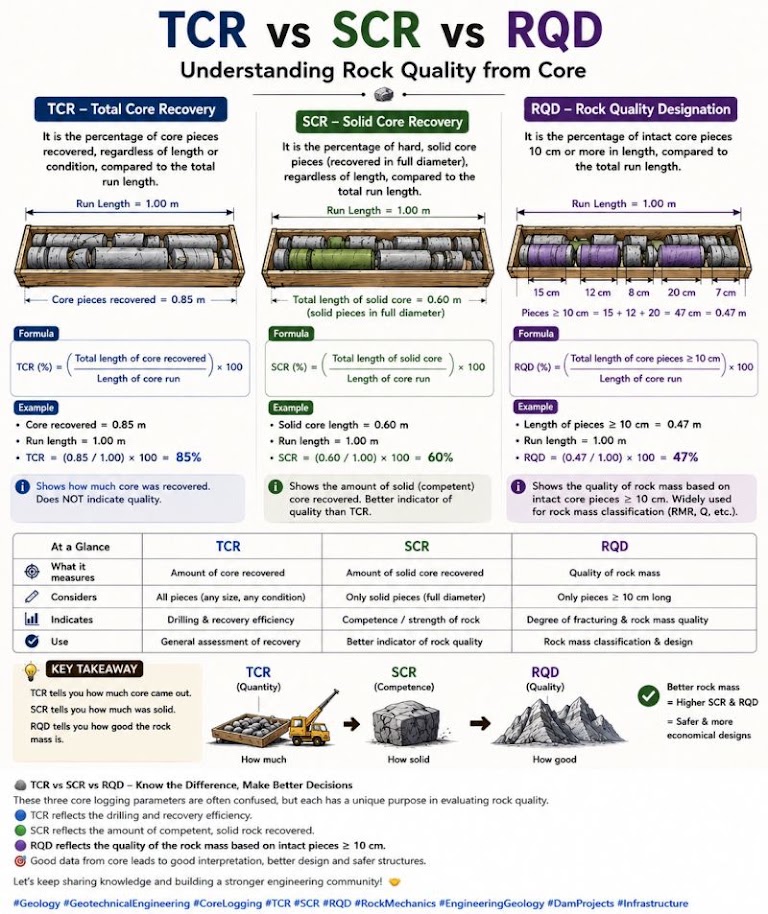
USBR’s field rules (after Deere) remove most of the logger-to-logger scatter in RQD:
Table 6-S1. USBR fracture density descriptors (excludes mechanical breaks)
| Code | Descriptor | Criteria |
|---|---|---|
| FD0 | Unfractured | No observed fractures |
| FD1 | Very slightly fractured | Core mostly in lengths > 3 ft |
| FD3 | Slightly fractured | Mostly 1–3 ft, few scattered lengths < 1 ft or > 3 ft |
| FD5 | Moderately fractured | Mostly 0.33–1.0 ft, most about 0.67 ft |
| FD7 | Intensely fractured | Average 0.1–0.33 ft with fragmented intervals |
| FD9 | Very intensely fractured | Mostly chips and fragments with a few short core lengths |
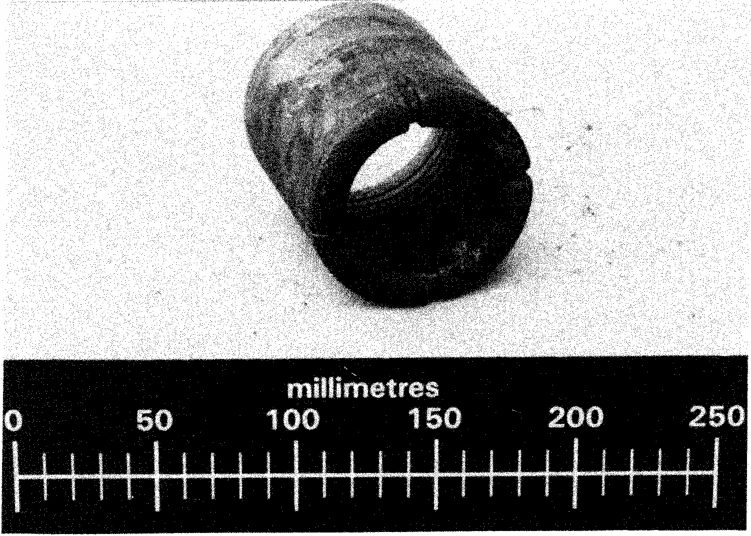
Even-numbered codes (FD2, FD4, FD6, FD8) are used for intervals “in between” two descriptors. Report fracture frequency (natural fractures per foot) alongside RQD; a full entry reads, for example, “Slightly fractured (FD3), core in 0.8–4.7 ft lengths, mostly 1.7 ft; 25% bedding joints / 75% joints.”
Source: U.S. Bureau of Reclamation (1998). Engineering Geology Field Manual, 2nd ed., Vol. I, Ch. 5 (Discontinuities)
Table 6-S2. Rock core drilling methods (GEC 5, Table 5(b), after Day, 1999)
| Method | Sample | Best application | Limitations |
|---|---|---|---|
| Rotary coring, conventional double tube (ASTM D2113) | 0.9–4 in. core up to 10 ft long; standard 2.1 in. (NX-class) | Continuous core in sound rock | Core lost in fractured or variable rock; bedding and joint dip visible but not strike |
| Wire-line coring | 1.1–3.3 in. core, 5–10 ft runs | Fractured rock (less caving during core removal); deep holes with faster cycle time | Same core-loss and orientation limits |
| Triple-tube with plastic liner | 1.1–2.1 in. core encased in liner | Swelling clays, shales and soft rock that swell or slake in air | Smaller sample; more complex equipment |
For railroad cut slopes and bridge foundations in shale, specify triple-tube (split inner tube or liner) coring: shale and claystone that slake on contact with drilling water are routinely logged as “poor RQD” when the fracturing is actually drilling-induced.
Source: Sabatini, P. J. et al. (2002). Evaluation of Soil and Rock Properties. Geotechnical Engineering Circular No. 5, FHWA-IF-02-034
Project context: We are conducting a subsurface investigation for a BNSF bridge approach embankment replacement in western Kansas. A boring is advanced to 35 ft through silty sand overburden underlain by medium-dense alluvial sand. The water table is at 8 ft below the existing ground surface.
Given data at 20-ft depth:
Step 1 — Calculate N₆₀:
Step 2 — Calculate vertical total stress at 20 ft:
Step 3 — Calculate pore water pressure at 20 ft:
Step 4 — Calculate effective vertical stress:
Step 5 — Calculate C_N:
Step 6 — Calculate (N₁)₆₀:
Interpretation: (N₁)₆₀ = 26 classifies this material as Dense Sand. Relative density D_r ≈ 75–80%. The material is not liquefiable under BNSF's design seismic loading (M_w = 5.0 for the Central Great Plains region). Proceed to Chapter 14 for formal liquefaction screening.
Project context: We are sampling a soft marine clay layer at 22–26 ft depth in a boring for an Amtrak bridge approach embankment rehabilitation project along the NEC in New Jersey. Amtrak ES requires piston sampling for soft clays, but our field crew has a 3.5-in. OD push tube available. Evaluate acceptability.
Given:
Calculate AR:
Result: AR = 7.5% < 10% — tube meets ASTM D 1587 geometric requirements. However, because Amtrak Engineering Standards explicitly require piston sampling for soft clay specimens used in undrained shear strength determination, we must use the fixed-piston sampler regardless of push-tube AR compliance. Document this requirement in the pre-field plan and procure piston sampler equipment before mobilization.
Project context: We are coring a 10-ft run of sandstone for an NSR bridge scour and foundation investigation in the Appalachian region of Virginia. Core size is HQ. The recovered core pieces, measured in the core box, are as follows:
| Piece | Length |
|---|---|
| 1 | 7.0 in. |
| 2 | 2.5 in. (fractured, < 4 in. — excluded) |
| 3 | 9.5 in. |
| 4 | 1.0 in. (excluded) |
| 5 | 6.5 in. |
| 6 | 8.0 in. |
| 7 | 0.5 in. (excluded) |
| 8 | 4.5 in. |
| 9 | 3.0 in. (excluded) |
| 10 | 2.5 in. (excluded) |
| Totals | Recovered = 45.0 in. |
Pieces ≥ 4 in.: 7.0 + 9.5 + 6.5 + 8.0 + 4.5 = 35.5 in.
Total run length: 10 ft = 120 in.
TCR:
Interpretation: RQD = 30% → Poor rock quality. The low RQD combined with TCR = 37.5% indicates highly fractured sandstone — likely a weathered zone or fault-adjacent interval. Per NSR ESM, a geologist must review the core box photographs and provide a written characterization of fracture type, orientation (estimated), and roughness before proceeding with foundation design. This material is unlikely to be suitable for end bearing without significant socket depth into competent rock below.
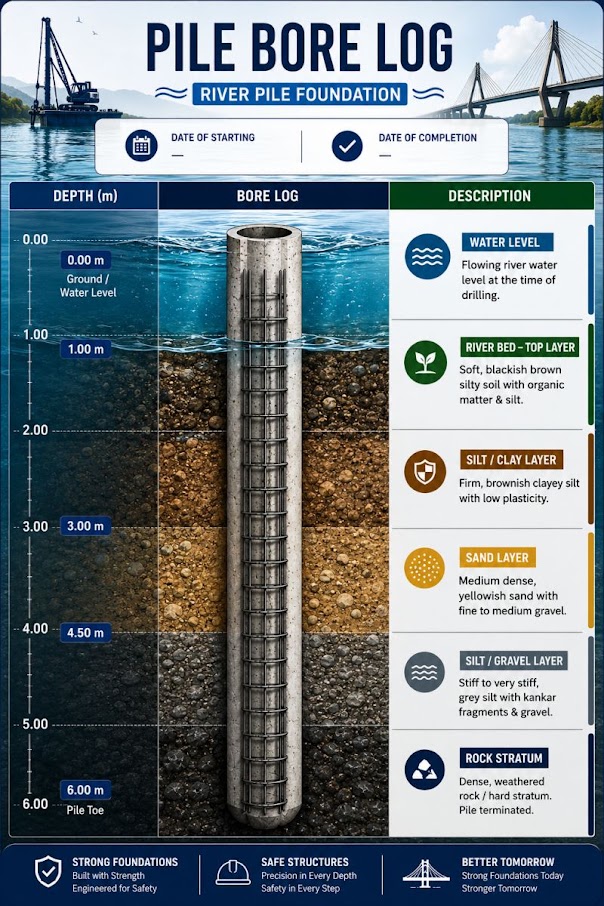
Project: NSR Bridge Replacement — Culpeper Subdivision, Virginia Boring: B-2 Date: April 15, 2026 Driller/Rig: APEX Drilling, Diedrich D-50 Track Rig Drilling Method: HSA (0–42 ft), Mud Rotary (42–65 ft) Hammer Type: Automatic Trip (E_m = 0.83, measured by PDA) Water Table: Encountered at 18.0 ft during drilling; stabilized at 16.5 ft after 30 minutes
| Depth (ft) | Sample | Blows (6"/6"/6") | N_raw | N₆₀ | Soil Description | Lab Tests |
|---|---|---|---|---|---|---|
| 0–2 | SS-1 | 3/4/4 | 8 | 10 | Brown medium sand, trace gravel; fill | — |
| 5–6.5 | SS-2 | 5/6/7 | 13 | 16 | Brown silty fine sand; dense; moist | Sieve |
| 10–11.5 | SS-3 | 8/10/12 | 22 | 28 | Gray silty sand; medium dense; moist | Sieve, Atterberg |
| 15–16.5 | ST-1 | Push | — | — | Gray-brown firm silty clay; push recovery 18 in. | Consol, UU Tri |
| 20–21.5 | SS-4 | 12/15/18 | 33 | 42 | Gray sandy gravel; dense; wet; below GWT | — |
| 25–26.5 | SS-5 | 18/22/25 | 47 | 60 | Gray sandy gravel; very dense; wet | — |
| 30–31.5 | SS-6 | 50/4" | R | — | Refusal at 30+0.33 ft (34 in. for 50 blows) | — |
| 35–36.5 | CS-1 | Core run | TCR=75% | — | Gray medium sandstone; RQD=55%; moderately fractured | Unconf. Comp. |
| 40–41.5 | CS-2 | Core run | TCR=92% | — | Gray-brown sandstone; RQD=88%; slightly fractured | — |
SS = Split Spoon; ST = Shelby Tube; CS = Core Sample; R = Refusal; GWT = Groundwater Table; Consol = Consolidation; UU Tri = Unconsolidated-Undrained Triaxial; Unconf. Comp. = Unconfined Compression
Figure 6-1 Placeholder: Full-scale boring log in NSR Engineering Standards Manual format, showing graphical soil profile, blow count vs. depth plot, water level indicators, and sample retention summary. [Insert CAD or boring log software output here.]
Reference graphics
| Sample | Depth (ft) | Soil Description | w_n (%) | LL (%) | PL (%) | PI | γ_d (pcf) | USCS | Lab Tests Completed |
|---|---|---|---|---|---|---|---|---|---|
| SS-3 | 10–11.5 | Silty fine sand | 14.2 | 22 | 18 | 4 | 104 | SM | Sieve, Atterberg |
| ST-1 | 15–16.5 | Silty clay | 38.7 | 48 | 24 | 24 | 82 | CL | Consol, UU Tri |
| SS-4 | 20–21.5 | Sandy gravel | 8.1 | NP | NP | NP | 118 | GW-GM | Sieve |
| CS-1 | 35–36.5 | Sandstone core | — | — | — | — | — | Rock | Unconf. Comp. |
Reference graphics
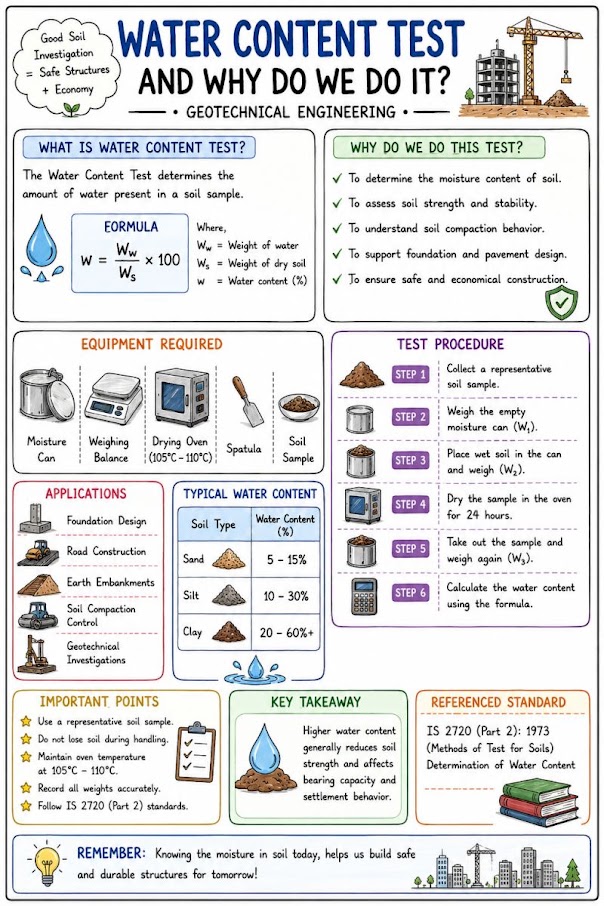
Figure 6-2 Placeholder: Photograph of split-spoon sampler assembly showing barrel, cutting shoe, ball valve, and head assembly; SPT blow count recording sheet example.
Figure 6-3 Placeholder: Photograph of 3-in. Shelby tube sample being sealed with wax and end caps for transport; chain-of-custody form example.
Figure 6-4 Placeholder: HQ core box photograph showing piece labeling, depth markings, and RQD measurement tape layout; reference UPRR EIM §GT-101 photographic documentation requirements.
Figure 6-5 Placeholder: Drilling rig setup on railroad ROW with spotter and track protection; erosion/containment measures for mud rotary operations; CSXT ES ROW compliance signage.
Reference graphics
Hunt describes two sampling methods for soils that thin-walled tubes handle poorly:
Source: Hunt, R. E. (2005). Geotechnical Investigation Methods: A Field Guide for Geotechnical Engineers. CRC Press
Haidar gives the basic duration relation used in CPM scheduling:
Activity duration = Work quantity ÷ Production rate (Haidar Eq. 3.1)
The time unit (hours, shifts, days) may be anything, provided it is used consistently throughout the schedule. He notes that the estimates need not be exact. When every duration is reasonable, over- and under-estimates tend to offset, and spending too much effort refining individual durations makes the schedule harder to build without making it better. He lists the factors that control how accurate an estimate will be: number of projects, complexity, design duration, construction method, resource availability, work quantity, labor and equipment productivity, quality of field management, geography and site conditions, and concurrent activities. He recommends getting each estimate from the person who will manage the work.
On logic, Haidar recognizes three relationships: predecessor, successor, and concurrent (independent). Concurrent means only that neither activity depends on the other, not that they must run at the same time. There is usually more than one correct sequence, and choosing among them requires knowing how the work is actually built.
For railroad work: split the drilling quantity by method, because production differs widely. Soil drilling with SPT intervals, Shelby tube sampling, rock coring and in-hole testing each need their own quantity and rate. Production rates should come from the firm’s own driller records for similar ground and access, not from catalog figures. Express the rate per effective hour under track protection. As an illustration only: 480 ft of soil drilling at 30 ft per effective hour is 16 effective hours. If a track window yields about 5 effective hours after protection setup, moves between holes and clearing, the work needs 4 windows. Add separate activities for rock coring, grouting or backfill, and the move-in and move-out of each site. Off-track work, such as CPT soundings from an access road or borings at the embankment toe, is often concurrent with on-track borings and can fill time when windows are cancelled. Record actual footage and hours each shift so that the next program’s production rates are better than this one’s.
Source: Haidar, A. D. (2016). Construction Program Management – Decision Making and Optimization Techniques. Cham, Switzerland: Springer International Publishing, pp. 64–66. Summarized and paraphrased. Full reference under Supplemental Sources.
Checklist · Part V · Subsurface Exploration
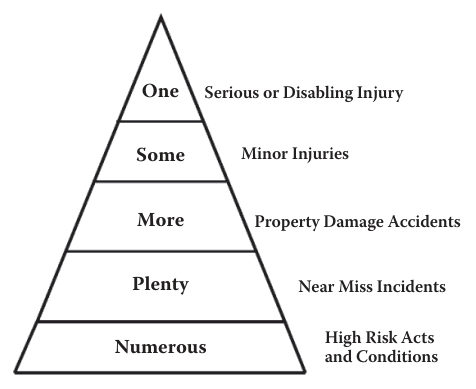
McKinnon (2012) builds on the accident ratio: for every serious injury there are larger numbers of minor injuries, more property-damage events, many near misses, and beneath those a broad base of high-risk acts and conditions. Heinrich (1931) reported 1 serious injury : 29 minor injuries : 300 no-injury accidents. Bird and Germain (1966), from nearly 2 million reported accidents, gave 1 serious : 10 minor : 30 property damage : 600 near misses. A British Tye-Pearson study gave 1 : 3 : 50 first aid : 80 damage : 400 near misses, and the U.K. HSE (1993) gave 1 : 11 : 441. McKinnon stresses that the exact numbers matter less than the conclusion: near misses are far more frequent than injuries, and often the only difference between the two is luck.
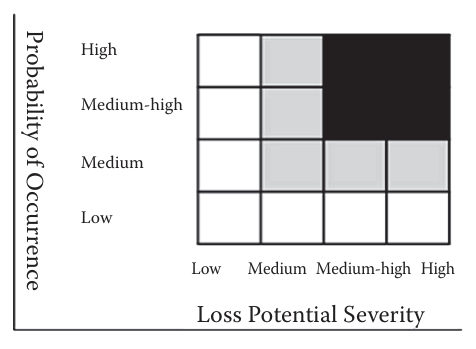
Because near misses share the same causes as accidents, they are free warnings. McKinnon’s system (recognition, reporting, risk ranking, investigation and remedy) does not investigate every report. Each near miss is ranked on a simple matrix of potential loss severity versus probability of recurrence. Events in the high–high cell are investigated as rigorously as a serious injury, as are high–medium-high and medium-high–medium-high events; lower-ranked reports are tracked and addressed once the high-potential ones are under control. He cites the “critical few” principle: perhaps 20% of near misses hold 80% of the loss potential. A no-blame policy is essential, since programs fail when reporting leads to discipline. He notes that rail has adopted this model through CIRAS, a confidential reporting system used in Britain.
For railroad work: Add near-miss reporting to the borings and sampling field checklist. Drilling on the right-of-way combines rotating equipment and overhead or buried utilities with train movements and roadway worker protection, so close calls such as a rig mast near the foul envelope, an unannounced train during setup, or a mislocated utility should be recorded on the daily report, ranked, and discussed at the next job briefing. The railroad’s own close-call program (for example FRA’s C3RS on participating carriers) may also apply; follow the client’s reporting rules.
Source: McKinnon, R. C. (2012). Safety Management: Near Miss Identification, Recognition, and Investigation. Boca Raton, FL: CRC Press (Taylor & Francis), pp. 12–17, 24–26. Summarized and paraphrased; figures reproduced for internal reference. Full reference under Supplemental Sources.
Pre-Mobilization
During Drilling
Post-Field
McKinnon (2012) builds on the accident ratio: for every serious injury there are larger numbers of minor injuries, more property-damage events, many near misses, and beneath those a broad base of high-risk acts and conditions. Heinrich (1931) reported 1 serious injury : 29 minor injuries : 300 no-injury accidents. Bird and Germain (1966), from nearly 2 million reported accidents, gave 1 serious : 10 minor : 30 property damage : 600 near misses. A British Tye-Pearson study gave 1 : 3 : 50 first aid : 80 damage : 400 near misses, and the U.K. HSE (1993) gave 1 : 11 : 441. McKinnon stresses that the exact numbers matter less than the conclusion: near misses are far more frequent than injuries, and often the only difference between the two is luck.
Because near misses share the same causes as accidents, they are free warnings. McKinnon’s system (recognition, reporting, risk ranking, investigation and remedy) does not investigate every report. Each near miss is ranked on a simple matrix of potential loss severity versus probability of recurrence. Events in the high–high cell are investigated as rigorously as a serious injury, as are high–medium-high and medium-high–medium-high events; lower-ranked reports are tracked and addressed once the high-potential ones are under control. He cites the “critical few” principle: perhaps 20% of near misses hold 80% of the loss potential. A no-blame policy is essential, since programs fail when reporting leads to discipline. He notes that rail has adopted this model through CIRAS, a confidential reporting system used in Britain.
For railroad work: Add near-miss reporting to the borings and sampling field checklist. Drilling on the right-of-way combines rotating equipment and overhead or buried utilities with train movements and roadway worker protection, so close calls such as a rig mast near the foul envelope, an unannounced train during setup, or a mislocated utility should be recorded on the daily report, ranked, and discussed at the next job briefing. The railroad’s own close-call program (for example FRA’s C3RS on participating carriers) may also apply; follow the client’s reporting rules.
Source: McKinnon, R. C. (2012). Safety Management: Near Miss Identification, Recognition, and Investigation. Boca Raton, FL: CRC Press (Taylor & Francis), pp. 12–17, 24–26. Summarized and paraphrased; figures reproduced for internal reference. Full reference under Supplemental Sources.
| Topic | See Chapter |
|---|---|
| Boring location and depth planning | Chapter 5 |
| SPT-based classification | Chapter 8 |
| In situ testing (CPT, VST, PMT) | Chapter 7 |
| Groundwater measurements during drilling | Chapter 9 |
| Foundation bearing capacity from SPT | Chapter 11 |
| Settlement analysis from consolidation samples | Chapter 12 |
| Liquefaction screening using (N₁)₆₀ | Chapter 14 |
| Laboratory testing of recovered samples | Chapter 10 |
| Boring log reporting and submittal | Appendix E |
Question 2-1 (UPRR Bridge Investigation — SPT Correction)
A boring is advanced to 45 ft for a UPRR bridge abutment investigation in Nebraska. At 35-ft depth, the raw SPT N-value is 24 blows/ft. The boring uses a 5-in. nominal borehole with a donut hammer (E_m = 0.45) and a split spoon without liner. Rod length at test is 35 ft. The soil profile consists of silty sand (γ = 118 pcf) from 0–12 ft, then saturated alluvial sand (γ_sat = 125 pcf) from 12 to 35 ft, with the water table at 12 ft.
(a) Calculate N₆₀. (b) Calculate (N₁)₆₀. (c) Classify the relative density of the sand at 35 ft. (d) UPRR EIM §GT-101 requires automatic trip hammers on all UPRR bridge borings. What action is required, and what does this imply for the N₆₀ calculated above?
Answer:
(a) C_B = 1.05 (5-in. borehole); C_R = 1.00 (rod > 20 ft); C_S = 1.00 (no liner); E_m = 0.45
(b) σ_v = (12)(118) + (23)(125) = 1,416 + 2,875 = 4,291 psf; u = (23)(62.4) = 1,435 psf; σ'_v = 4,291 − 1,435 = 2,856 psf
(c) N₆₀ = 19 → Medium Dense. (N₁)₆₀ = 16 → Medium Dense.
(d) UPRR EIM §GT-101 prohibits donut hammers on UPRR bridge borings. This boring was conducted in violation of UPRR standards. The N₆₀ values calculated above (19 blows/ft) are based on E_m = 0.45. Had an automatic hammer been used (E_m = 0.82), N₆₀ would be 24 × (0.82 × 1.05 × 1.00)/0.60 = 24 × 1.435 = 34.4 ≈ 34 blows/ft — nearly 80% higher. Using the donut-hammer N₆₀ for design would produce unconservative foundation and liquefaction assessments. The boring data is suspect and must be either rejected and redrilled (preferred) or reported with a prominent data quality caveat and used only for qualitative interpretation. Notify the UPRR project engineer immediately.
Question 2-2 (Amtrak NEC — Shelby Tube Acceptability)
On an Amtrak NEC rehabilitation project in Connecticut, the field geologist pushes a Shelby tube with an OD at the cutting shoe of 3.0 in. and an ID of 2.875 in. into a soft organic clay layer at 18 ft depth. The recovered sample length is 14.5 in. against a push of 18 in.
(a) Calculate the Area Ratio. Is the tube geometrically acceptable per ASTM D 1587? (b) Calculate the Sample Recovery Ratio (SRR = recovered length / push length × 100%). What does a low SRR indicate? (c) Amtrak ES requires piston sampling for soft clay on NEC projects. What should the field team do?
Answer:
(a) AR = (3.0)2 - (2.875)2(2.875)2 × 100% = 9.000 - 8.2668.266 × 100% = 8.9% < 10% ✓ Tube is geometrically acceptable per ASTM D 1587.
(b) SRR = (14.5/18) × 100% = 80.6%. An SRR below ~85–90% in soft clay suggests partial sample loss or compression during recovery — likely piping of soft material past the ball valve or compression of gas-rich organic clay. Sample is potentially disturbed near the base.
(c) Despite geometric acceptability of the push tube, Amtrak ES explicitly requires a fixed-piston sampler for soft clay. The push-tube sample does not meet Amtrak's sampling standard regardless of AR. Retain this sample for water content and index testing only. Re-sample the interval using a fixed-piston sampler on the next pull. Document the deviation and corrective action in the field log.
Question 2-3 (G&W Short Line — RQD and Foundation Implications)
We are conducting a bridge investigation for a G&W property in Missouri. A 10-ft HQ core run in a weathered limestone yields the following intact piece lengths: 2.5 in., 5.0 in., 0.5 in., 8.5 in., 1.0 in., 6.0 in., 3.0 in., 7.5 in., 2.0 in., 4.5 in. Total core recovered = 40.5 in.
(a) Calculate RQD and TCR. (b) Classify rock quality. (c) G&W's project budget calls for end bearing on limestone. What is the geotechnical recommendation based on this RQD?
Answer:
(a) Pieces ≥ 4 in.: 5.0 + 8.5 + 6.0 + 7.5 + 4.5 = 31.5 in.; Total run = 120 in.
RQD = 31.5120 × 100% = 26.3% ≈ 26% TCR = 40.5120 × 100% = 33.8%
(b) RQD = 26% → Poor rock quality; TCR = 34% — highly fractured and/or cavity-bearing limestone.
(c) End bearing on this weathered, highly fractured limestone carries significant risk of punching failure into voids or soft infill. Recommend: (1) advance the boring through this zone to characterize the full thickness of weathered rock; (2) assess for karst features (solution channels, voids) using rotary wash returns and loss-of-circulation monitoring; (3) if sound rock is encountered below this zone at acceptable depth, redesign for rock-socketed drilled shafts bearing in competent rock (RQD > 50%); (4) consider AREMA MRE Chapter 8 requirements for design end bearing stress in fractured limestone — typically limited to 5–15 tsf net for RQD 25–50%, compared to 20–40 tsf in competent rock.
Question 2-4 (CSXT Emergency Response — Drilling Method Decision)
CSXT's track maintenance division reports a sudden track geometry deviation (surface and cross-level) at MP 243.2 on the Montgomery Subdivision. The deviation appeared overnight and is suspected to be related to subsurface sinkhole activity or soft ground collapse. CSXT has imposed a 10-mph slow order and requests a geotechnical field investigation within 48 hours.
(a) What drilling method is most appropriate for this emergency investigation and why? (b) What special documentation must be provided to CSXT per their Engineering Standards for an emergency investigation? (c) What is the minimum boring program to characterize the subsurface condition within the 48-hour timeline?
Answer:
(a) HSA with mud rotary backup. HSA is fastest to mobilize and set up within the active ROW slow order zone. If running sands or collapse cavities are encountered, immediately switch to mud rotary with casing to maintain borehole integrity and prevent additional ground loss. Air rotary is not appropriate where soft ground or collapse features are suspected — the injection of air pressure may destabilize a marginal cavity.
(b) CSXT Engineering Standards for emergency investigations require: (i) a preliminary field observation report within 24 hours of mobilization, (ii) daily verbal briefing to the CSXT Division Engineer, (iii) an immediate written notification if any condition that affects track safety is discovered during drilling (e.g., soft zone at track subgrade elevation, open cavity), and (iv) chain-of-custody records for all samples. The preliminary report must include at minimum: boring location survey coordinates, water table depth, soil profile narrative, and a qualitative geohazard assessment.
(c) Minimum program within 48 hours: Three borings — one centered on the geometry deviation, one 25 ft north, one 25 ft south along the track centerline. Depths to 30 ft minimum or 10 ft into competent material, whichever is deeper. SPT at 2.5-ft intervals through the zone of suspected disturbance (top 15 ft). Grab samples at all SPT intervals for water content. Shelby tubes in any soft cohesive layer. Photograph all samples. Deliver preliminary field logs and geohazard assessment by end of Day 2.
Question 2-5 (CPKC Bridge Foundation — Core Size and RQD Protocol)
CPKC's bridge engineering group has requested a rock core investigation for a bridge replacement over the Assiniboine River in Manitoba. Rock at this location is Ordovician dolomite, expected at approximately 50 ft depth. CPKC Track Standards require HQ core for final design borings.
(a) What is the core diameter recovered with HQ core? (b) The first 10-ft run in dolomite yields intact pieces of 11.0 in., 8.0 in., 14.0 in., 3.5 in., 9.0 in., 5.5 in., 8.5 in., and 7.5 in. Total recovery = 67.0 in. Calculate RQD and TCR. (c) CPKC requires that boring logs include both RQD and TCR on a run-by-run basis. How should this data be presented in the boring log? (d) What unconfined compressive strength (UCS) testing is typically required for Ordovician dolomite bearing design, and why?
Answer:
(a) HQ core recovers a 2.50-in. diameter core.
(b) Pieces ≥ 4 in.: 11.0 + 8.0 + 14.0 + 9.0 + 5.5 + 8.5 + 7.5 = 63.5 in. (3.5 in. piece excluded); Total run = 120 in.
RQD = 63.5120 × 100% = 52.9% ≈ 53% TCR = 67.0120 × 100% = 55.8%
Rock quality: RQD = 53% → Fair. The discrepancy between RQD (53%) and TCR (56%) is small, suggesting most fragments are fractured but not completely lost — consistent with moderate fracturing in dolomite. Continue coring to characterize the full rock mass.
(c) Present RQD and TCR in the boring log in a dedicated column pair at the right edge of the graphical log, reported as percentages on a run-by-run basis. Plot a separate RQD vs. depth bar chart alongside the boring log for visual interpretation. Include core box photo reference numbers adjacent to each run interval. Per CPKC Track Standards, highlight any run with RQD < 25% (Very Poor) in bold red and flag for geologist review note.
(d) UCS testing on at minimum three specimens per rock unit is required per AREMA MRE Chapter 8 and CPKC Track Standards for bearing design on rock. UCS establishes the unconfined compressive strength (q_u) used to set allowable end bearing pressure for drilled shaft design — typically taken as 1–5% of q_u adjusted for RQD and joint condition per AASHTO LRFD. For Ordovician dolomite, q_u commonly ranges from 5,000 to 20,000 psi; even at the lower bound, bearing capacity on intact dolomite will far exceed structural demands from Cooper E-80 loading, making the primary design driver foundation socket geometry and uplift resistance rather than bearing failure.
Field case studies by Burt G. Look, from Earthworks: Theory to Practice – Design and Construction (CRC Press/Balkema, 2023), chosen for this chapter’s topics. Each is summarized from the book with its key figures and a closing note on railroad application added by the authors of this manual. Credit for the case material belongs to Look; see item S12 under Supplemental Sources.
Related section: 6.2 Drilling Method Selection
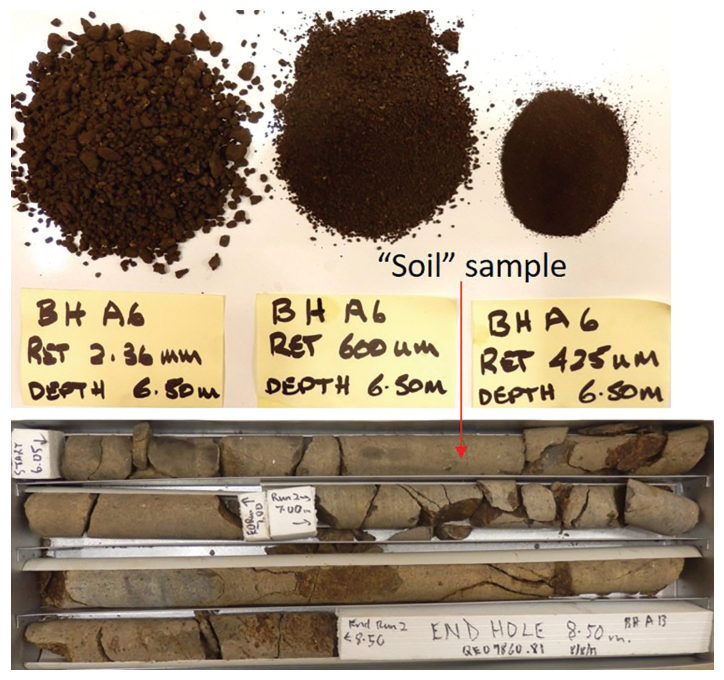
During construction a project manager ordered extra probe holes and concluded that a different, softer material had been found. It had not. The probes were drilled with a tungsten-carbide (TC) bit auger, while the design borings had been cored. Low- to medium-strength basalt with natural fractures at roughly 4 in spacing was crushed by the heavy rig, and the cuttings came up as “soil” graded through the No. 8, No. 30 and No. 40 sieves. Side by side with the adjacent core, the probe hole produced a new “soil” stratigraphy that conflicted with the design rock profile.
Look notes two related habits. Highly weathered rock is often described as soil in any case, and the material just above the start of coring is usually logged conservatively as a weaker grade because the SPT or wash sample there is less informative than core. Visual strength classification, point load index and other rock testing should be done on the core.
For railroad work: when probe holes, auger refusals or contractor holes are used to check rock levels for cuts, culvert footings or pile toes, record the drilling method on every log and compare like with like. A change of drilling technique is not a change of material.
Source: Look, B. G. (2023). Earthworks: Theory to Practice – Design and Construction. CRC Press/Balkema. Case study §2.6, pp. 68–70. Summarized and paraphrased; figures reproduced for internal reference. Full reference under Supplemental Sources.
Related section: 6.3 Standard Penetration Test (SPT) — Procedure and Corrections
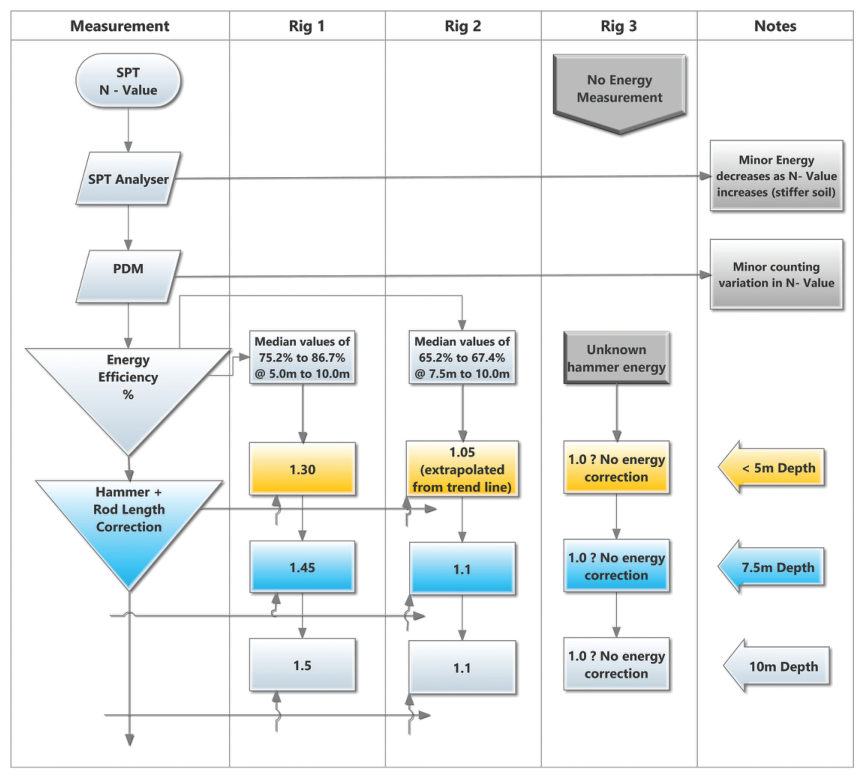
An SPT N-value is reported as “factual”, but only whole blows can be counted, and the 6 in increments are judged against a chalk mark 0.2–0.39 in. wide in the under-7-second window between blows. That reading error alone is 7%–13% per increment. Digitally measured increments with a 6 in. target averaged 5.8 in. with a standard deviation of 0.63 in. (range 4.3–7.5 in.), a coefficient of variation of 11%–15%. The two test increments partly compensate; the error carried over from the seating drive matters more.
On a large investigation with three rigs, hammer energy and rod length were measured on Rigs 1 and 2. Rig 1 needed a correction factor of about 1.5, so its design strength and modulus rose by 50%. Rig 2 needed almost none. Rig 3 was never measured and was assumed to be 1.0. Across the 1,120 tests, 18% of N-values below 50 changed density class once corrected.
Look’s recommendation is that every rig carry a current energy certificate, as a laboratory carries accreditation, so the cost is shared across projects and firms that measure energy are not undercut by those that do not.
Table 6-LK1. Change in density class after energy correction, 1,120 SPTs at one site (after Look 2023, Table 6.19)
| Density class | Original N | Energy-corrected N60 | % changed |
|---|---|---|---|
| Very loose (< 4) | 45 | 43 | 4% |
| Loose (< 10) | 179 | 162 | 11% |
| Medium dense (< 30) | 446 | 354 | 25% |
| Dense (< 50) | 77 | 174 | 18% |
| Very dense (≥ 50), excl. rock | 50 | 64 | n/a |
For railroad work: ask for the hammer energy ratio with every boring subcontract and record the rig on each log. Liquefaction screening, pile capacity and bearing checks on railroad bridges all use corrected N60; an uncorrected value from an unmeasured rig is not a design value.
Source: Look, B. G. (2023). Earthworks: Theory to Practice – Design and Construction. CRC Press/Balkema. Case study §6.12, pp. 194–196. Summarized and paraphrased; figures reproduced for internal reference. Full reference under Supplemental Sources.
Authors: Daniel P. Colwell and Mario Ruel. This chapter was written and compiled by Daniel P. Colwell and Mario Ruel for Railway Ground Hazard Risk Management.
Technical content is drawn from the published sources below, and credit for that material belongs to their authors and publishers. Tables, equations and figures taken from a specific source are also cited where they appear.
File locations for these documents are listed under Supplemental Sources — LEVI Library.
Material in the green “Supplemental reference” boxes throughout this chapter was added from the following documents in the LEVI geotechnical library. Text is summarized or paraphrased; tables are reproduced with their original source noted; figures are reproduced from the cited document for internal reference use. Consult the original document before relying on a value for design. The Case Studies section summarizes case studies from item S12 by Burt G. Look; its figures are reproduced from the book for internal reference use, and the closing “For railroad work” note in each case study is added by the authors of this manual. Blocks tagged “Project management” summarize methods, examples and figures from the project-management, estimating and construction-management books listed here, applied to railroad work; the closing “For railroad work” note in each block is added by the authors of this manual.