
Geotechnical engineering libraryContact
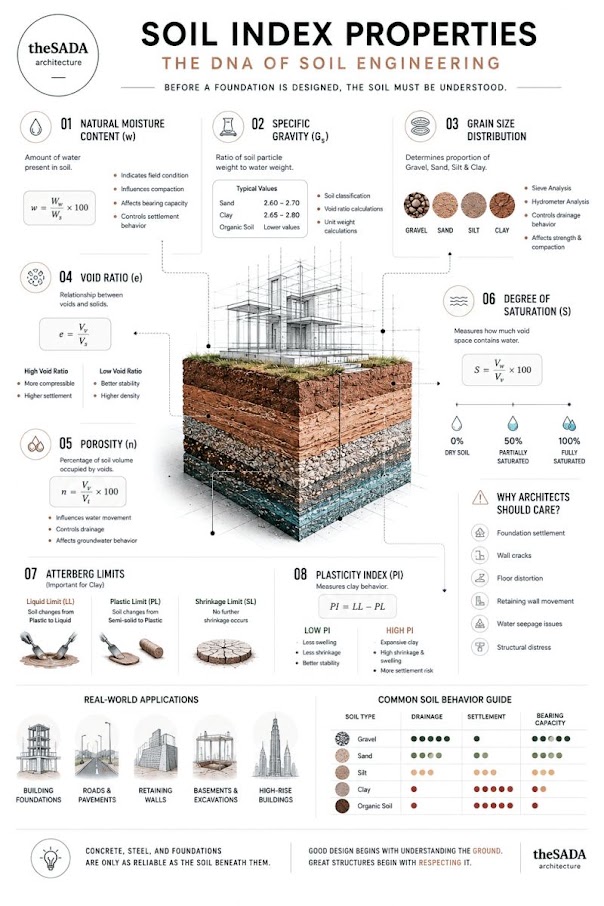
Primary Reference: USACE EM 1110-1-1804, Geotechnical Investigations (2001), Sections 3-1 through 3-8; ASTM D2487, D3282, D4318, D422, D1140, D2938; AREMA MRE Chapter 1, Sections 1.3–1.4; AASHTO M 145.
Apps on dirtbert.com that support this chapter. Each one runs in a web browser on a desktop or a phone, with nothing to install. How to use the apps (I.3).
NANCY pages ask you to accept the Use and Disclaimers once in each browser.
Consistent, reproducible classification of soil and rock is the common language shared between field personnel, laboratory technicians, design engineers, and railroad client reviewers. Every boring log, lab report, and geotechnical analysis submitted to CSXT, NSR, UPRR, BNSF, CPKC, Amtrak, CN, and G&W subsidiaries relies on a classification framework that is traceable to recognized standards — principally the Unified Soil Classification System (USCS, ASTM D2487) for soils, AASHTO M 145 for pavement subgrade classification, and quantitative rock quality indices (RQD, Rock Mass Rating, and Geological Strength Index) for rock. AREMA MRE Chapter 1 references both USCS and AASHTO M 145 as acceptable classification standards for railroad earthwork design. This chapter presents the full classification methodology for soils and rock in railroad project contexts, including Atterberg limit interpretation, gradation analysis, RQD (Chapter 6 cross-reference), RMR, and GSI. Three worked examples drawn from CSXT, NSR, and BNSF projects illustrate the classification process end-to-end. A representative data table, figure placeholders, practical recommendations, a field and lab checklist, and five practice questions with complete answers follow.
Railroad embankment fills, subgrade soils, and foundation materials are evaluated using classification results at every project phase. Specifically:
Reference graphics
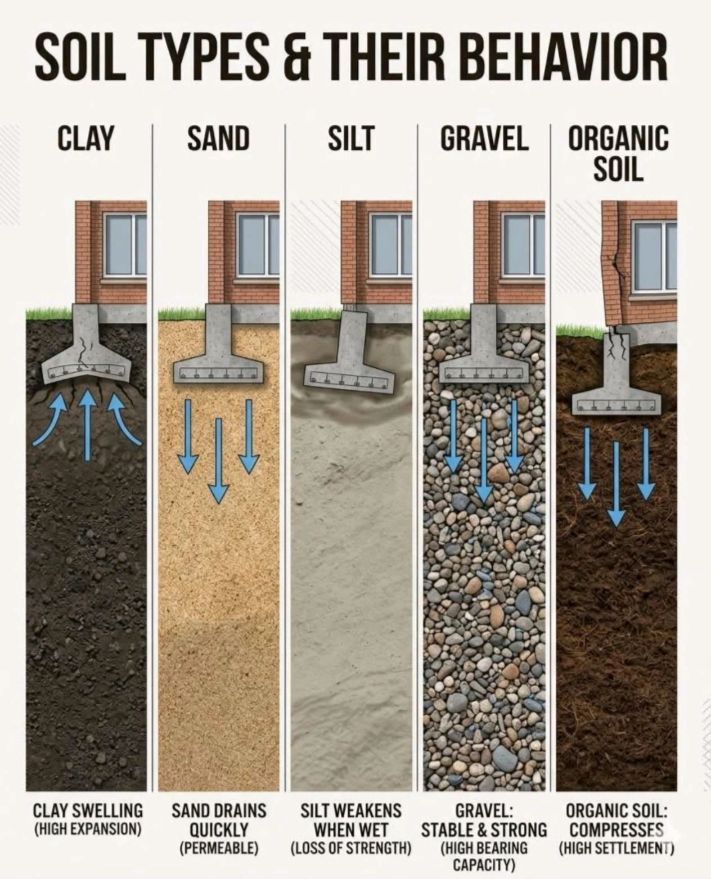
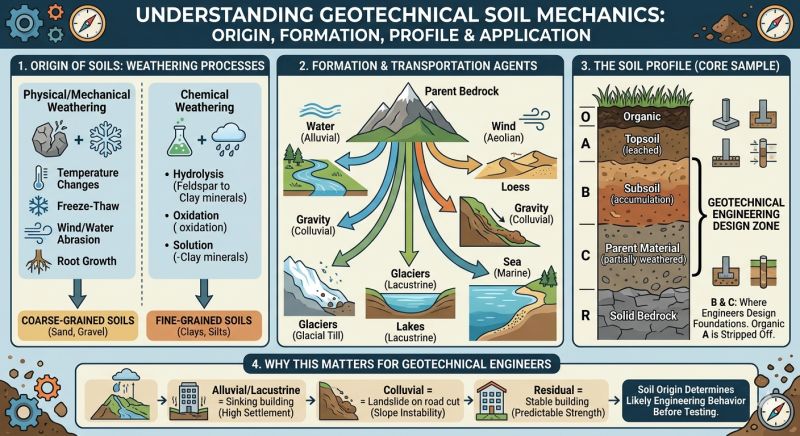
Reference graphics · click to zoom
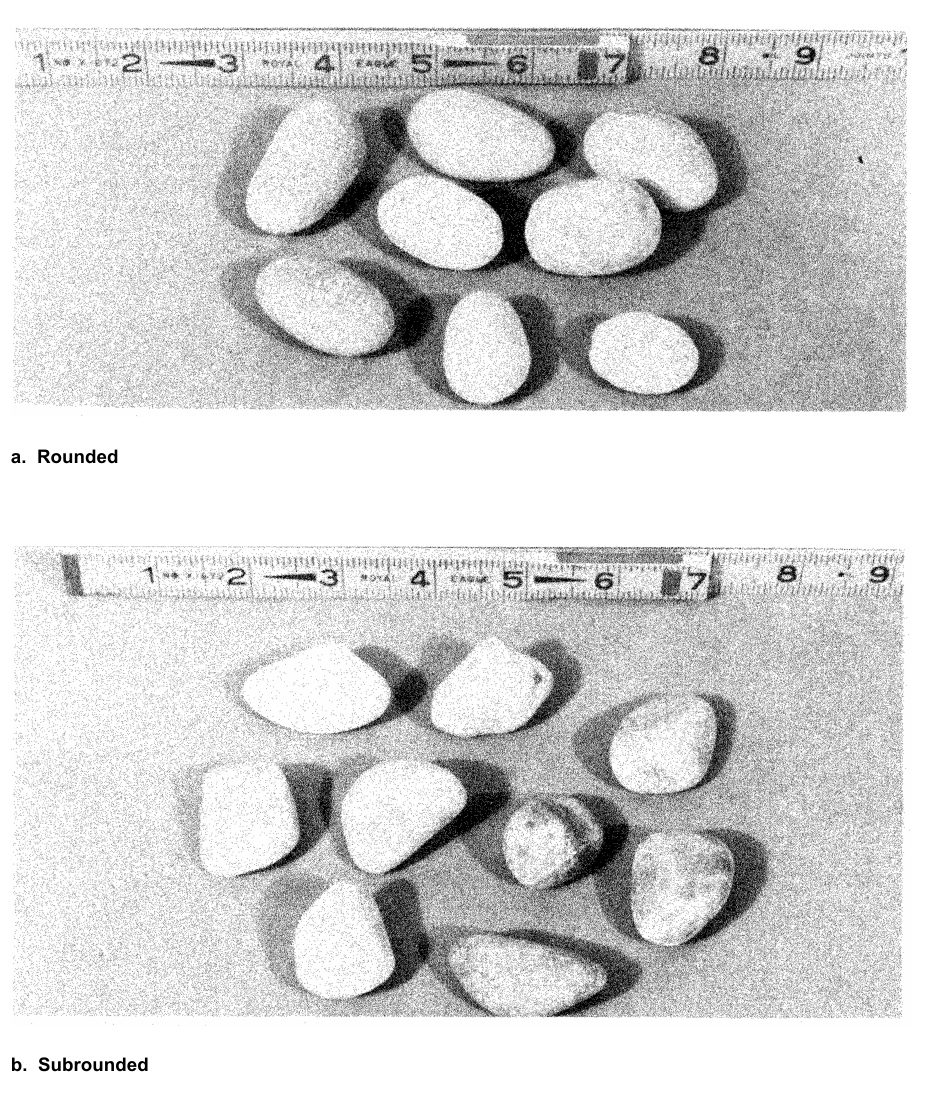
European railways have not used a single system. The United Kingdom, France, Germany, Switzerland and others use the Unified Soil Classification System (Casagrande); Scandinavian railways rely mainly on grain size; Italy, Greece and others use the AASHO (now AASHTO) system. Profillidis calls the USCS the most generally applicable. ASTM D2487 is based on it but requires laboratory classification tests and subdivides further, whereas USCS allows a tentative visual classification. BS 5930 also derives from Casagrande but draws the sand and gravel boundaries differently, and DIN 4022 subdivides silt, sand and clay into fine, medium and coarse.
Figure 8-10 compares the grain-size boundaries of the main systems. They do not coincide (the silt–sand boundary, for example, falls between 0.02 mm and 0.074 mm), so check which system a historic log used before carrying its descriptions into a UIC or AREMA subgrade assessment.
Figures · click to zoom
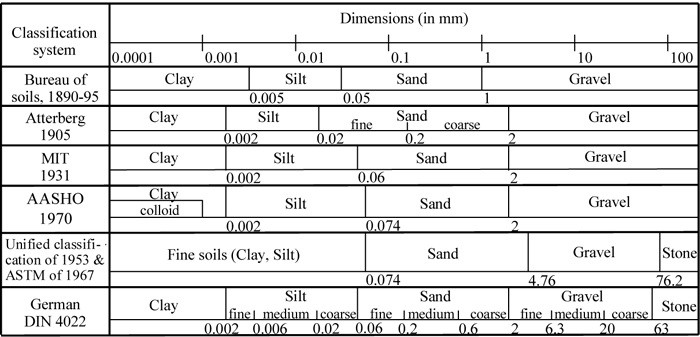
After Profillidis (2014), §9.3, Fig. 9.2. Full reference under Supplemental Sources.
Sieve analysis separates soil particles by mechanical sieving through a standardized stack of sieves. Key sieves and particle size boundaries:
| Sieve | Opening (in.) | Particle Class Boundary |
|---|---|---|
| 3 in. | 3.00 | Coarse gravel / cobble |
| ¾ in. | 0.75 | Fine gravel / coarse gravel |
| No. 4 | 0.187 | Gravel / sand boundary |
| No. 10 | 0.079 | Coarse / medium sand |
| No. 40 | 0.0165 | Medium / fine sand |
| No. 200 | 0.0029 | Sand / fines boundary |
Reference graphics
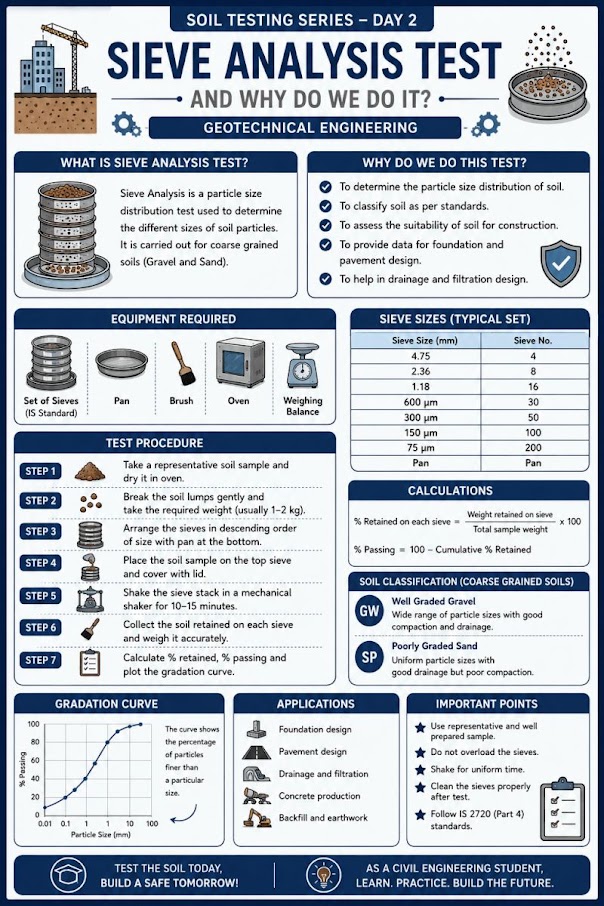
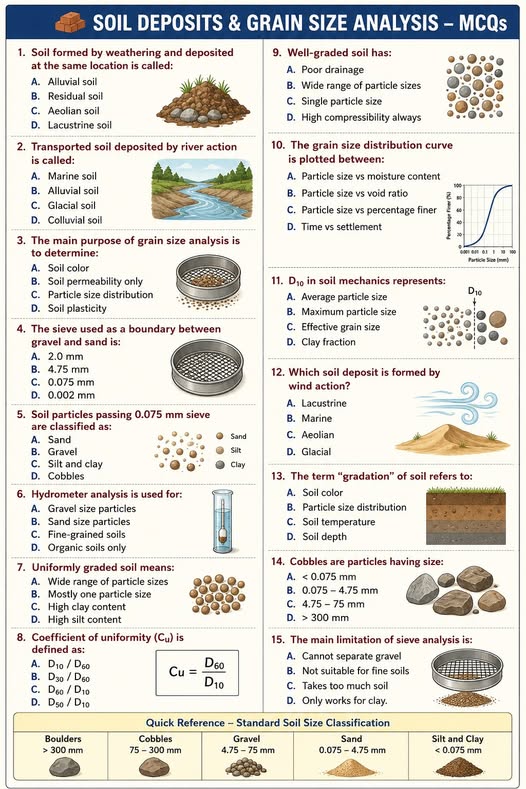
P_i (%) = [Mass passing sieve i / Total dry mass of specimen] × 100
C_u = D_60 / D_10
C_c = (D_30)² / (D_10 × D_60)
Where D_10, D_30, D_60 = grain diameter (mm or in.) at which 10%, 30%, and 60% of the soil mass is finer, respectively.
Gravel classification: Well-graded gravel (GW) requires C_u ≥ 4 and 1 ≤ C_c ≤ 3. Poorly graded gravel (GP) fails either criterion. Sand classification: Well-graded sand (SW) requires C_u ≥ 6 and 1 ≤ C_c ≤ 3. Poorly graded sand (SP) fails either criterion.
For the fines fraction (passing No. 200 sieve), hydrometer analysis determines the silt/clay boundary at 0.002 mm (2 µm). The hydrometer reading at elapsed time t is converted to equivalent particle diameter using Stokes' Law:
Reference graphics · click to zoom
D = √(18 × η × L / (G_s − 1) × γ_w × t)
Where:
Note: In English practice, hydrometer results are still reported in mm for particle size; the USCS boundary between silt and clay remains at 0.002 mm regardless of unit system.
Case study: 8.14.1 Gradings before and after compaction: the oversize that was never tested (Look 2023), in §8.14 Case Studies.
Case study: 8.14.2 Representative sampling from a weathered-rock stockpile (Look 2023), in §8.14 Case Studies.
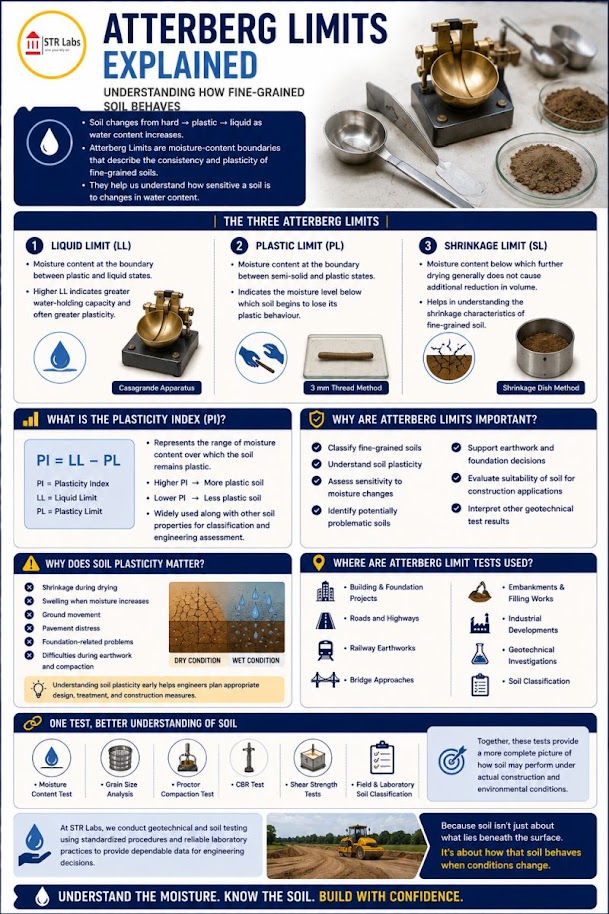
Atterberg limits define the moisture content boundaries between soil behavioral states for fine-grained soils. They are measured on the fraction passing the No. 40 sieve.
No additional content.
Reference graphics
Reference graphics · click to zoom
PI = LL − PL
LI = (w_n − PL) / PI
Where w_n = natural (field) water content (%). Interpretation:
| LI | Consistency State |
|---|---|
| < 0 | Stiff / desiccated |
| 0–0.25 | Very stiff |
| 0.25–0.50 | Stiff |
| 0.50–0.75 | Medium |
| 0.75–1.00 | Soft |
| > 1.00 | Very soft / approaching liquid state |
Activity (A) — clay mineralogy indicator:
A = PI / (% clay fraction)
Where % clay fraction = % finer than 0.002 mm from hydrometer analysis.
| A | Clay Mineral Type |
|---|---|
| < 0.75 | Inactive (kaolinite dominant) |
| 0.75–1.25 | Normal (illite dominant) |
| > 1.25 | Active (montmorillonite / smectite) |
Activity > 1.25 is a critical flag on all railroad projects: highly active clays exhibit significant swell potential when wetted after desiccation — a chronic track geometry problem along CSXT's Carolina division, BNSF's Texas Panhandle routes, and UPRR's expansive clay zones in Wyoming and Colorado. CN Engineering Standards require swell testing (ASTM D4546) whenever A > 1.0.
The shrinkage limit (ASTM D4943) is the water content below which further drying causes no volume change. For railroad embankments in seasonally dry climates (BNSF Great Plains, UPRR Southwest, CN Prairie), SL data inform desiccation crack depth estimates used in slope stability models (Chapter 13).
Table 8-S3. Typical Atterberg limits for clay minerals (Carter & Bentley, Table 8.2)
| Mineral | PL (Ca++) | LL (Ca++) | PL (Na+) | LL (Na+) | Typical activity |
|---|---|---|---|---|---|
| Montmorillonite | 65–79 | 123–177 | 86–97 | 280–700 | Ca 1.5; Na 7.2 |
| Illite | 36–42 | 69–100 | 34–41 | 61–75 | 0.9 |
| Kaolinite | 26–36 | 34–73 | 26–28 | 29–52 | 0.33–0.46 |
Table 8-S4. Swelling potential from plasticity index (Carter & Bentley, Table 8.4)
| Swelling potential | PI (Seed et al., 1962) | PI (Krebs & Walker, 1971) |
|---|---|---|
| Low | 0–15 | 0–15 |
| Medium | 10–30 | 15–24 |
| High | 20–55 | 25–46 |
| Very high | > 40 | > 46 |
Table 8-S5. Expansion potential from shrinkage limit and linear shrinkage (after Altmeyer, 1955)
| Potential | Shrinkage limit (%) | Linear shrinkage (%) |
|---|---|---|
| Critical | < 10 | > 8 |
| Marginal | 10–12 | 5–8 |
| Non-critical | > 12 | < 5 |
Swelling potential here is the percent swell of a laterally confined specimen compacted at optimum moisture (standard Proctor) and soaked under a 1 psi surcharge: 0–1.5% low, 1.5–5% medium, 5–25% high, > 25% very high. Seed et al. (1962) related it to plasticity as S = 60K·PI2.44 with K = 3.6 × 10⁻⁵, valid for clay contents of 8–65% and accurate to about ±33% of lab values. Because each index is uncertain, Holtz and Gibbs (adopted by USBR) recommend judging expansion potential from colloid content, PI and shrinkage limit together, then confirming with an ASTM D4546 swell test where the result matters for track geometry.
Source: Carter, M. and Bentley, S. P. (2016). Soil Properties and their Correlations, 2nd ed. Wiley
For large corridor programs, NYSDOT’s GTM-7 (based on AASHTO T89) allows a one-point liquid limit: accept a trial that closes the groove in 15–30 drops, with at least two consistent consecutive closures, then LL = w (N/25)0.12. The factor ranges from 0.941 at 15 drops to 1.022 at 30 drops. Reserve multi-point flow curves for design-critical samples and borderline A-line soils.
Source: New York State DOT Geotechnical Engineering Bureau (2015). Test Method for Liquid Limit, Plastic Limit, and Plasticity Index, GTM-7 Rev. 2
Step 1 — Coarse or Fine?
Step 2 — For Coarse-grained soils:
Step 3 — For Fine-grained soils (plot on Casagrande Plasticity Chart):
Reference graphics
PI = 0.73 × (LL − 20)
PI = 0.9 × (LL − 8)
Classification matrix:
| Position on Chart | LL < 50 (Low Plasticity) | LL ≥ 50 (High Plasticity) |
|---|---|---|
| Above A-line | CL (lean clay) | CH (fat clay) |
| Below A-line or PI < 4 | ML (silt) | MH (elastic silt) |
| Organic (LL_oven < 0.75 × LL_wet) | OL | OH |
| Fibrous, very high water content | Pt (peat) | Pt |
Borderline classifications (e.g., CL-ML for soils plotting near the A-line with 4 ≤ PI ≤ 7) must be noted on boring logs submitted to BNSF, Amtrak, and CN — these clients explicitly require dual symbols in this zone.
Field logs use the visual-manual procedure (ASTM D2488). The USACE field tests, run on the minus No. 40 fraction:
| Test | Procedure | Interpretation |
|---|---|---|
| Dilatancy | Shake a 1-in. pat of moist soil in the palm, then squeeze it | Very fine clean sand: quick, distinct water and gloss. Inorganic silt: moderately quick. Plastic clay: no reaction. |
| Dry strength | Dry a putty-consistency pat and crumble it between the fingers | Strength increases with plasticity; high for fat clay. Silts and silty sands are slight — sand feels gritty, silt feels like flour. Break on a fresh surface, not a shrinkage crack. |
| Toughness | Roll a 1/8-in. thread repeatedly until it crumbles at the plastic limit, then knead the pieces | Stiffer threads and tougher lumps at the PL indicate higher clay content. |
| Ribbon | Flatten a 1/2–3/4 in. roll to 1/8–1/4 in. thick | High-plasticity clay: 8–10 in. ribbon; shorter for lower plasticity; non-plastic soil will not ribbon. |
USACE also lists quick checks for organic matter (odor), calcium carbonate cementation (dilute HCl), and whether a “rock-like” material is shale (slaking in water). Record color with Munsell soil color charts — color reflects mineralogy, drainage, and organic content.
Source: U.S. Army Corps of Engineers (2001). Geotechnical Investigations. EM 1110-1-1804
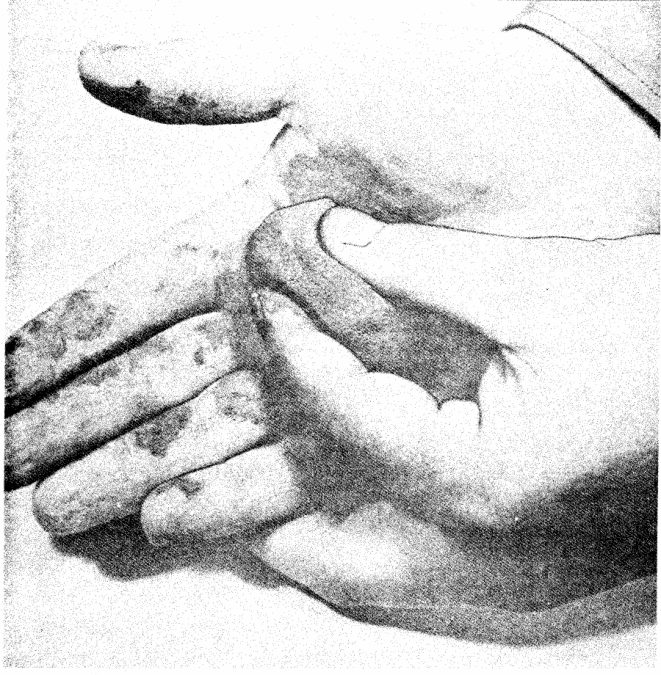
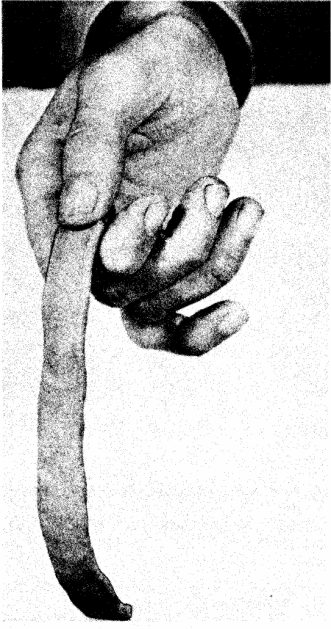
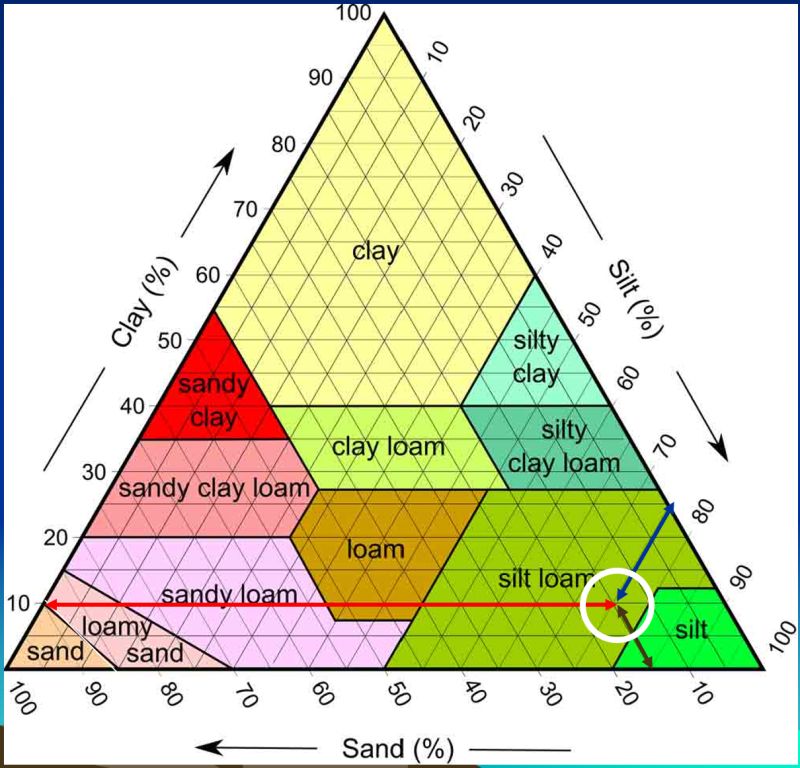
Coarse vs. fine follows the 50-50 rule: more than 50% passing the No. 200 sieve is fine-grained, and in coarse soils the No. 4 sieve separates sand from gravel. In a name like “silty sand,” the second word is the predominant material. Clay particles carry a charge that gives cohesion and plasticity; silt does not. Dry silt blows away as dust, wet silt feels slippery and wet clay feels sticky. The distinction matters operationally, because silts and fine sands can fail very rapidly while deep clay embankments tend to creep.
| Test | Silt | Low-plasticity clay | High-plasticity clay |
|---|---|---|---|
| Dilatancy (shake a wet pat) | Water appears quickly; pat loses shape | Water appears slowly; holds shape | No change |
| Toughness (roll a 1/8-in. thread) | Difficult to roll any thread | Easy, moderately plastic thread | Possible but difficult; very stiff |
| Dry strength (crush a dry 1/8-in. piece) | Crumbles with little pressure | Moderate | Cannot be broken with fingers |
Plasticity index guide used in the course: 0 non-plastic, 1–5 slightly plastic, 5–10 low, 10–20 medium, 20–40 high, and 40+ very high. Organic soils (topsoil, peat) are identified by fiber, color and odor and should be avoided as subgrade.
Figures · click to zoom
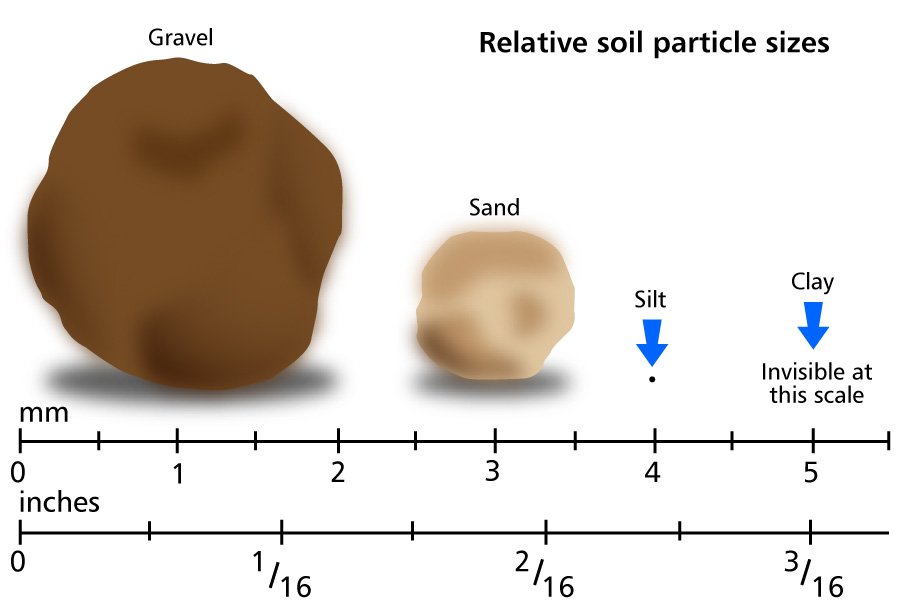

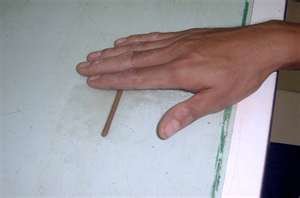
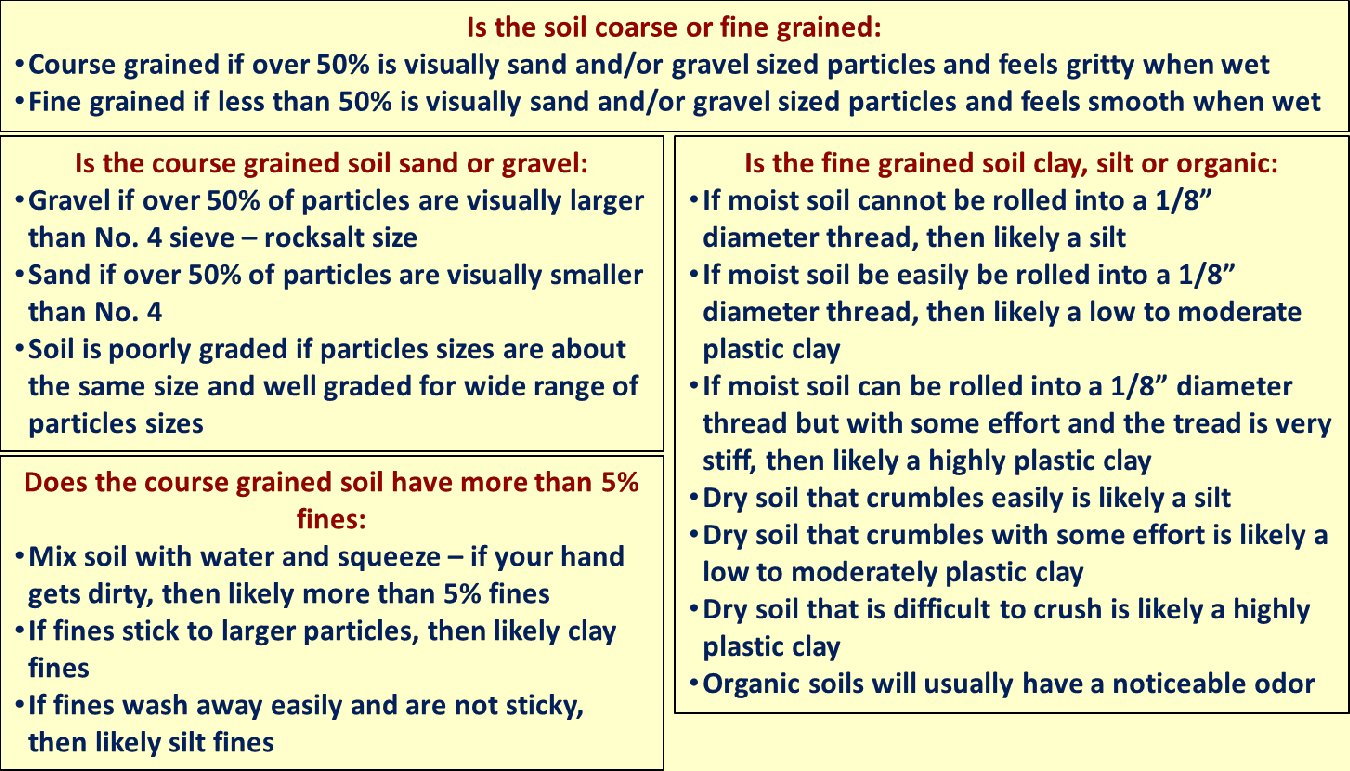
After Geotechnology for Railroaders Program, Module 2; §08, §10. Full reference under Supplemental Sources.
After Selig & Waters (1994), ch. 3. Full reference under Supplemental Sources.
The AASHTO classification (AASHTO M 145) is used specifically for pavement subgrade evaluation and is the primary soil classification system referenced by NSR and UPRR for track subgrade rehabilitation projects. It classifies soils into Groups A-1 through A-7 based on gradation and Atterberg limits.
| Group | % Pass No. 200 | LL | PI | Typical USCS | Subgrade Rating |
|---|---|---|---|---|---|
| A-1-a | ≤ 15 | — | ≤ 6 | GW, GP | Excellent |
| A-1-b | ≤ 25 | — | ≤ 6 | SW, SP, GM | Excellent |
| A-2-4 | ≤ 35 | ≤ 40 | ≤ 10 | GM, GC, SM | Good |
| A-2-6 | ≤ 35 | ≤ 40 | > 10 | GC, SC | Good-Fair |
| A-3 | ≤ 10 | NP | NP | SP | Good |
| A-4 | > 36 | ≤ 40 | ≤ 10 | ML, OL | Fair |
| A-5 | > 36 | > 40 | ≤ 10 | MH, OH | Fair-Poor |
| A-6 | > 36 | ≤ 40 | > 10 | CL | Poor |
| A-7-5 | > 36 | > 40 | ≤ LL − 30 | MH, CH | Poor |
| A-7-6 | > 36 | > 40 | > LL − 30 | CH | Very Poor |
Group Index (GI) — quantifies subgrade quality within a group:
Reference graphics
GI = (F − 35) × [0.2 + 0.005(LL − 40)] + 0.01(F − 15)(PI − 10)
Where:
GI = 0 indicates excellent subgrade; GI = 20 (maximum) indicates very poor subgrade. NSR's Engineering Standards Manual specifies ground improvement (Chapter 17) when GI ≥ 12 in track subgrade applications.
Reference graphics
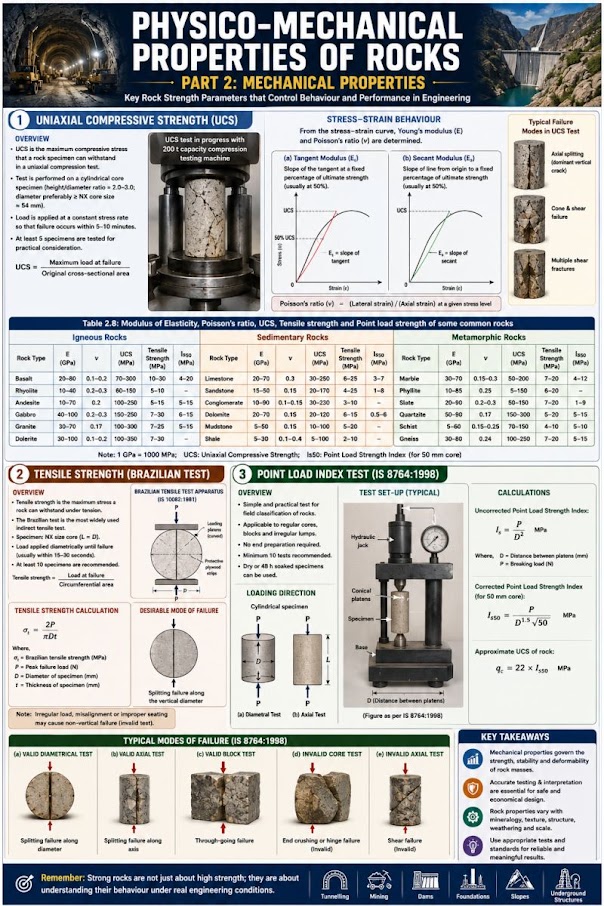
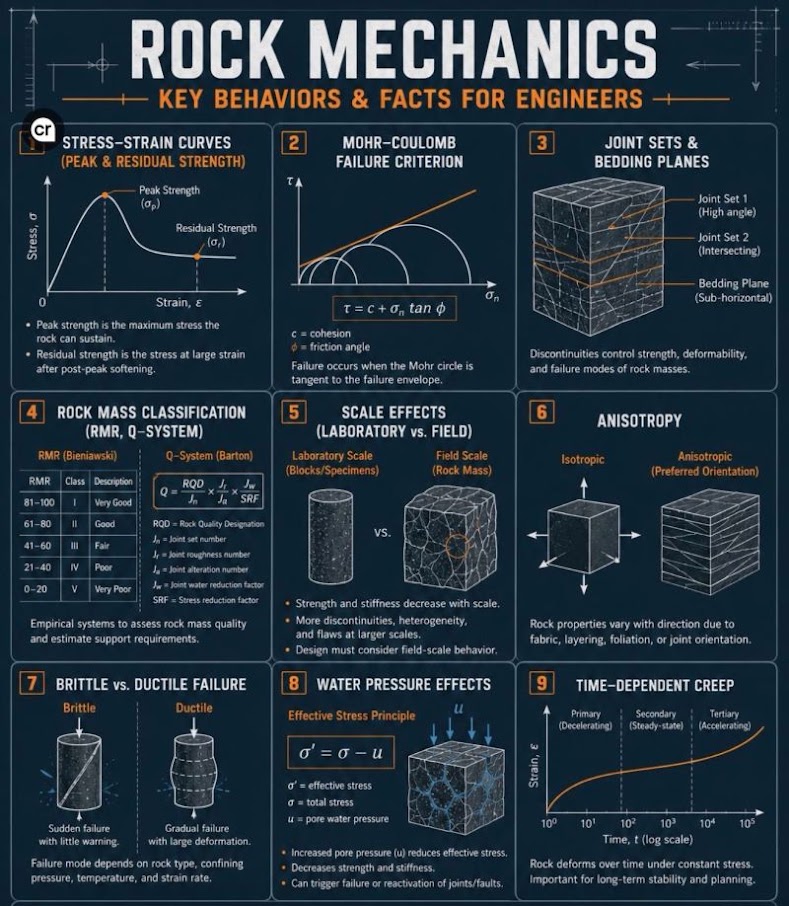
Reference graphics · click to zoom
RQD is calculated from rock core runs per the procedure established in Chapter 6 (Equation 2-4). To summarize:
Reference graphics
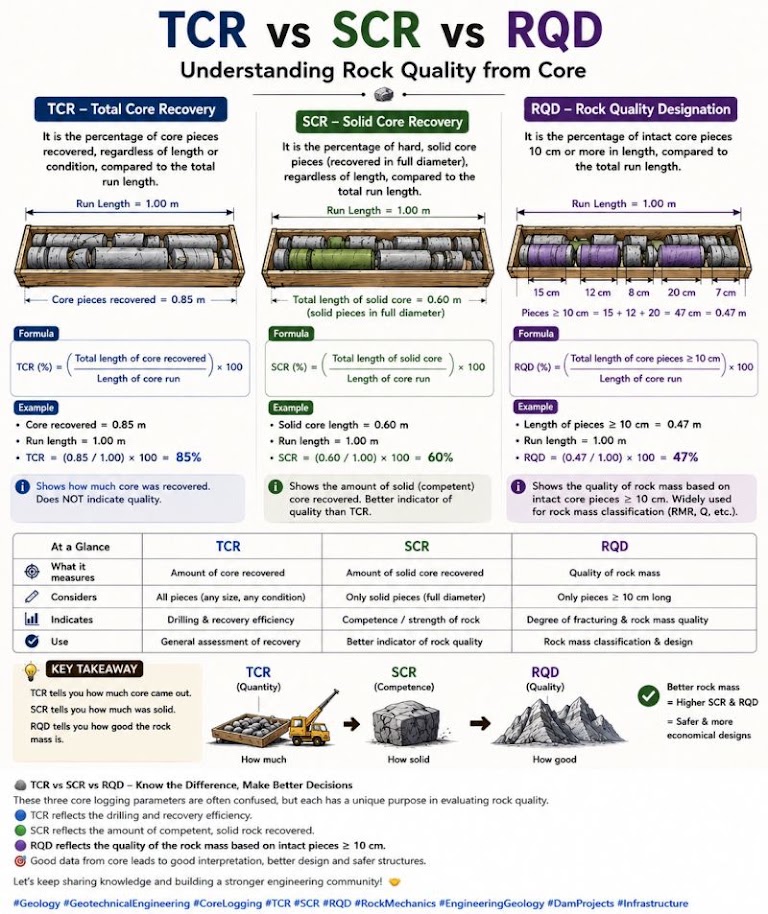
RQD (%) = [Σ length of intact core pieces ≥ 2 in.] / [Total core run length] × 100
| RQD (%) | Rock Quality |
|---|---|
| 0–25 | Very Poor |
| 25–50 | Poor |
| 50–75 | Fair |
| 75–90 | Good |
| 90–100 | Excellent |
NSR requires RQD to be calculated and recorded on every core run for Appalachian tunnel and rock cut projects. CPKC applies RQD as the primary acceptance criterion for rock riprap material on Rocky Mountain slope stabilization projects.
RMR classifies the overall rock mass quality using six parameters, each assigned a rating:
Reference graphics
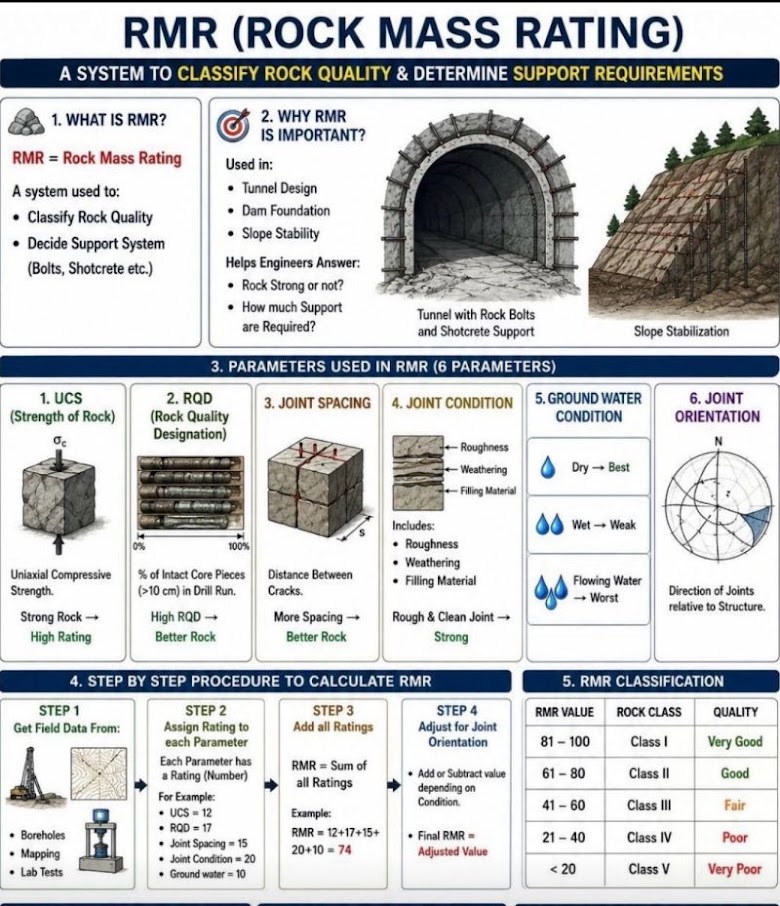
RMR = R₁ + R₂ + R₃ + R₄ + R₅ + R₆
| Parameter | Rating Range | Description |
|---|---|---|
| R₁ — UCS (psi) | 0–15 | UCS < 36 psi → 0; UCS > 29,000 psi → 15 |
| R₂ — RQD (%) | 3–20 | RQD 0–25% → 3; RQD 90–100% → 20 |
| R₃ — Spacing of discontinuities | 5–20 | < 2 in. → 5; > 6.6 ft → 20 |
| R₄ — Condition of discontinuities | 0–30 | Soft infill > 0.2 in. → 0; very rough, unweathered → 30 |
| R₅ — Groundwater | 0–15 | Flowing water → 0; dry → 15 |
| R₆ — Discontinuity orientation | −12 to 0 | Adjustment for orientation relative to structure |
| RMR | Rock Class | Description |
|---|---|---|
| 81–100 | I | Very good rock |
| 61–80 | II | Good rock |
| 41–60 | III | Fair rock |
| 21–40 | IV | Poor rock |
| 0–20 | V | Very poor rock |
RMR is used on NSR tunnel feasibility studies and on CPKC bridge pier excavation designs in the Canadian Shield. CN Engineering Standards reference RMR for classification of rock cut stability in their Geotechnical Engineering Manual, which we adapt for CN project deliverables.
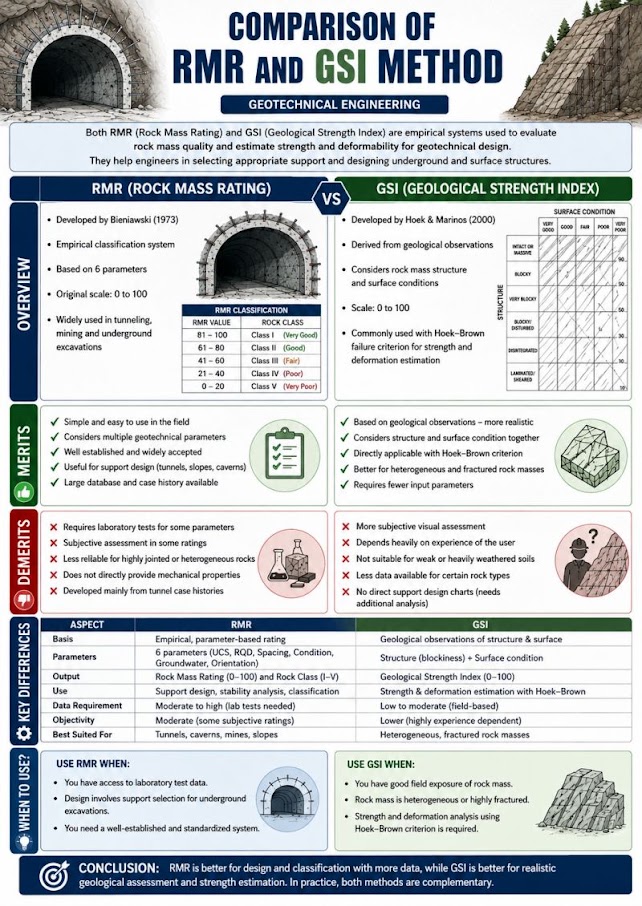
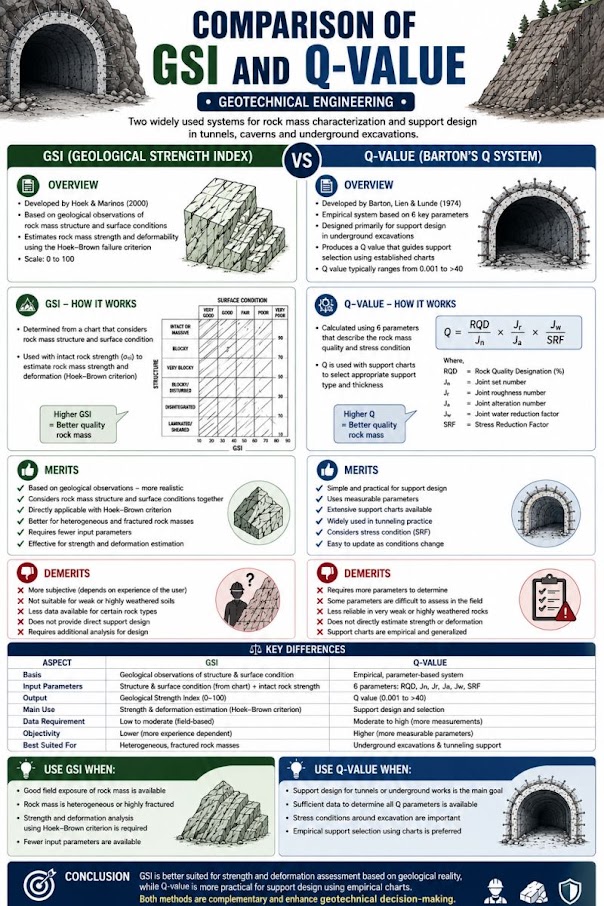
GSI provides a rock mass characterization input for the Hoek-Brown failure criterion, used in rock slope stability analyses (Chapter 13) for NSR and CPKC projects. GSI is estimated from field observation of structure and surface condition of discontinuities:
Reference graphics
σ'₁ = σ'₃ + UCS × (m_b × σ'₃/UCS + s)^a
Where:
GSI estimation charts (Marinos & Hoek 2000) are included in NSR project deliverables as a figure in the geotechnical data report (Appendix E).
The Q-system (Tunneling Quality Index) is used when NSR, CPKC, or Amtrak projects involve tunnel or large underground excavation design:
Reference graphics
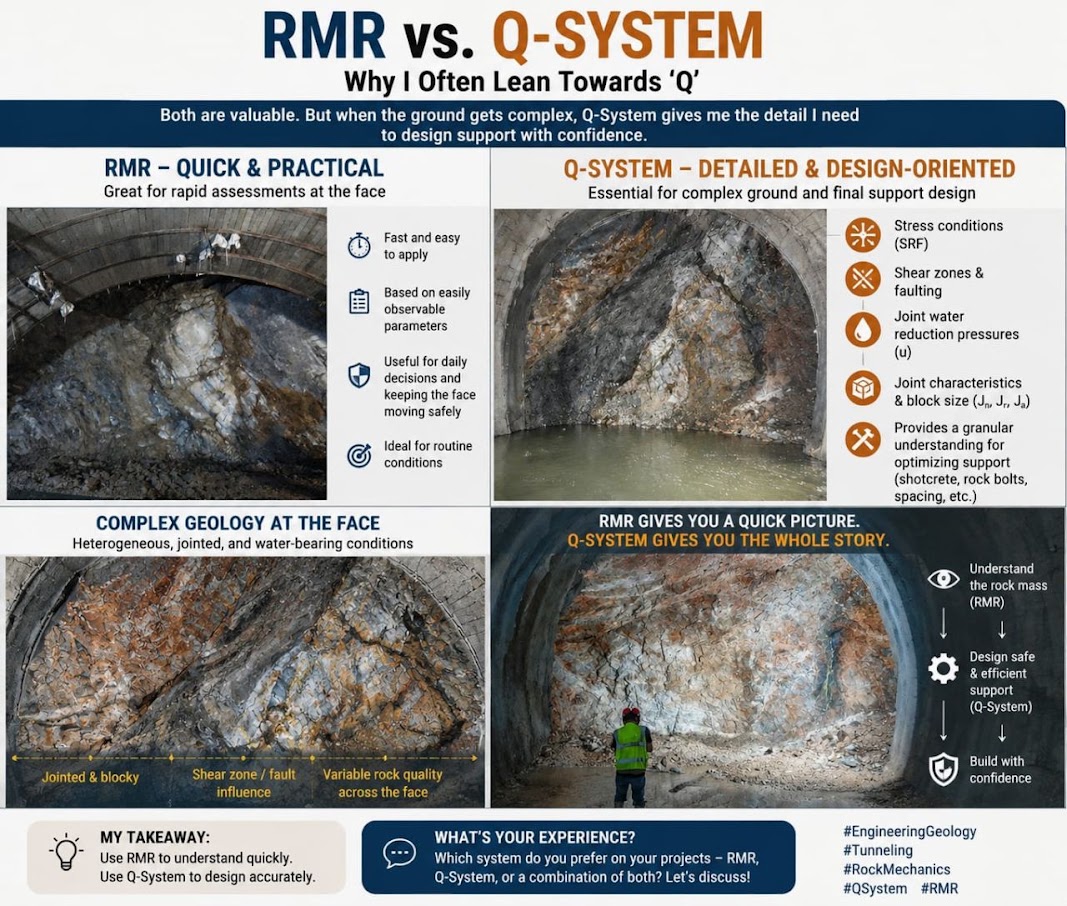
Q = (RQD / J_n) × (J_r / J_a) × (J_w / SRF)
Where:
| Q | Rock Class | Support Category |
|---|---|---|
| > 40 | Exceptionally good | Spot bolting |
| 10–40 | Very good | Systematic bolting |
| 1–10 | Good to fair | Shotcrete + bolts |
| 0.1–1 | Poor | Multiple passes |
| < 0.1 | Extremely poor | Heavy support |
Equation 8-11 above uses a 2-in. threshold. ASTM D6032, FHWA GEC 5 and the USBR field manual all define RQD using sound core pieces 4 in. or longer, measured along the core centerline, as Chapter 6 (Section 6.5.2) states. GEC 5 adds two rules often missed: pieces that are not hard and sound are excluded even if longer than 4 in. (so weathered rock is downgraded), and RQD is not appropriate for BQ/BX core — NQ/NX is optimal. Recommend revising Equation 8-11 to 4 in..
Table 8-S1. Rock material strength grades (GEC 5, Table 37)
| Grade | Description | Field identification | UCS range (psi) |
|---|---|---|---|
| R0 | Extremely weak | Indented by thumbnail | 36–145 |
| R1 | Very weak | Crumbles under firm blows of hammer point; peeled by pocket knife | 145–725 |
| R2 | Weak | Peeled by knife with difficulty; shallow indentations with firm hammer blow | 725–3,600 |
| R3 | Medium strong | Cannot be scraped or peeled with knife; fractured with single firm blow | 3,600–7,250 |
| R4 | Strong | More than one blow needed to fracture | 7,250–14,500 |
| R5 | Very strong | Many blows needed to fracture | 14,500–36,000 |
| R6 | Extremely strong | Can only be chipped | > 36,000 |
Table 8-S2. Weathering grades (GEC 5, Table 38)
| Grade | Term | Description |
|---|---|---|
| I | Fresh | No visible weathering; slight discoloration on major discontinuities possible |
| II | Slightly weathered | Discoloration of rock material and discontinuity surfaces; surface may be somewhat weaker |
| III | Moderately weathered | Less than half decomposed/disintegrated to soil; fresh or discolored rock as framework or corestones |
| IV | Highly weathered | More than half decomposed/disintegrated to soil; rock as framework or corestones |
| V | Completely weathered | All decomposed to soil; original mass structure largely intact |
| VI | Residual soil | All converted to soil; structure and fabric destroyed; not significantly transported |
A complete rock description strings these together in a set order, e.g. “slightly weathered, crystalline, gray, fine-grained, medium strong (R3) basalt,” followed by a rock-mass description of joint sets, spacing, persistence, infilling, roughness and seepage (GEC 5, after Wyllie). The strength grade gives the R1 input to RMR when no UCS test is available.
Source: Sabatini, P. J. et al. (2002). Evaluation of Soil and Rock Properties. Geotechnical Engineering Circular No. 5, FHWA-IF-02-034 · U.S. Bureau of Reclamation (1998). Engineering Geology Field Manual, 2nd ed., Vol. I
If an excavator can dig it, treat it as soil; once rock breaks apart, it behaves like soil. Igneous extrusive rock cooled quickly (basalt) is fine-grained and dark, and it is the preferred ballast family: the darker and finer, the better. Slowly cooled granite is coarser and less suitable. Sedimentary rock (sandstone, limestone) and metamorphic rock are generally not recommended for ballast; soft rock can grind into a mud spot within a few years.
Figures · click to zoom
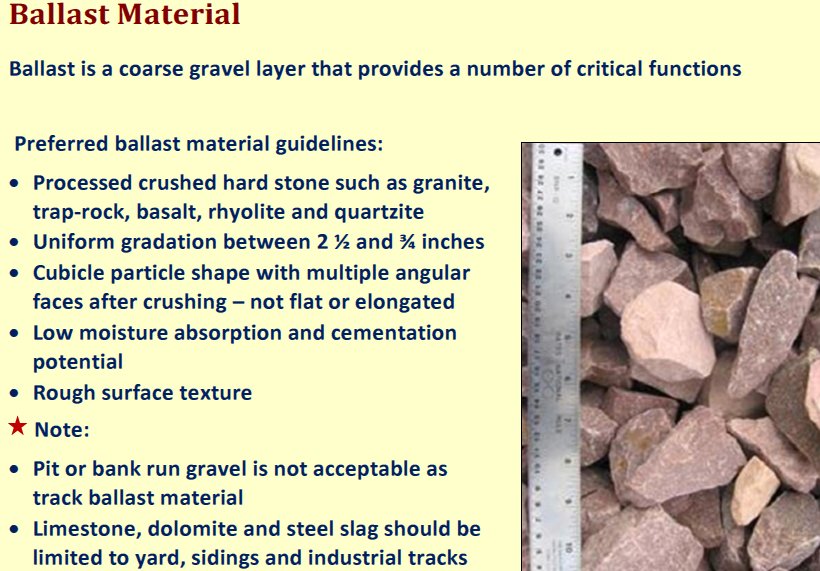
After Geotechnology for Railroaders Program, Module 2, Module 3; Module 2 §07; Module 3 §05. Full reference under Supplemental Sources.
For CPKC prairie mainline and CN Canadian operations, frost susceptibility is a primary classification criterion. The U.S. Army Corps of Engineers frost susceptibility classification:
| FS Class | Description | Frost Heave Risk |
|---|---|---|
| FS-0 | Non-frost-susceptible | Negligible |
| FS-1 | Slightly frost-susceptible | Slight |
| FS-2 | Moderately frost-susceptible | Moderate |
| FS-3 | Moderately to highly frost-susceptible | High |
| FS-4 | Very highly frost-susceptible | Very High |
Key criteria: GW, GP, SW, SP with < 3% fines = FS-0. ML, MH, and fine-grained silts with > 10% finer than 0.02 mm = FS-3 to FS-4. CH clays with high activity = FS-2 (heave dominated by water absorption, not ice lens formation). CN Engineering Standards require FS classification for all subgrade materials north of 45°N; CPKC Track Standards require frost index analysis (freezing degree-days) combined with FS class to determine minimum non-frost-susceptible ballast/subballast thickness.
The standard USACE groups (1965), which the FS classes above correspond to, are defined by the percent finer than 0.02 mm (20 μm), not the No. 200 sieve:
| Group | Soils |
|---|---|
| NFS | All soils with < 3% finer than 0.02 mm |
| F1 | Gravelly soils with 3–20% finer than 0.02 mm |
| F2 | Sands with 3–15% finer than 0.02 mm |
| F3 | Gravelly soils > 20% finer; sands (except silty fine sands) > 15% finer; clays with PI > 12; uniformly varved clays |
| F4 | Silts and sandy silts; fine silty sands > 15% finer; lean clays with PI < 12; non-uniform varved clays |
Susceptibility increases from F1 to F4. Carter and Bentley note that kaolinitic clays tend to heave more than montmorillonitic clays because water is more mobile in non-expanding clay structures — a counter-intuitive point when CH subgrade is assumed to be low frost risk. A quick screen (TRRL, 1970): granular soil with < 10% passing No. 200 is not susceptible; granular soil with > 10% fines or cohesive soil with PI < 20 is susceptible; cohesive soil with PI > 20 is not.
Confirm the frost-susceptibility classification with a hydrometer test, because the percent finer than 0.02 mm cannot be read from a sieve analysis.
Source: Carter, M. and Bentley, S. P. (2016). Soil Properties and their Correlations, 2nd ed. Wiley
Profillidis ranks silt as very frost-susceptible, clay as susceptible, and sand and gravel as not susceptible. Frost susceptibility is the third subgrade parameter, after soil class and hydrogeology, in climates where freezing is frequent. Protection is sized with the frost index (Chapter 2, §2.5).
After Profillidis (2014), §9.4, §9.11.1. Full reference under Supplemental Sources.
| Sample ID | Depth (ft) | % Pass No. 200 | LL (%) | PL (%) | PI (%) | USCS | AASHTO | GI | LI | Notes |
|---|---|---|---|---|---|---|---|---|---|---|
| B-1, S-2 | 3–5 | 68 | 52 | 22 | 30 | CH | A-7-6 | 16 | 0.83 | Fat clay; soft consistency; swell concern |
| B-1, S-4 | 8–10 | 44 | 38 | 19 | 19 | CL | A-6 | 8 | 0.47 | Lean clay; medium stiff |
| B-2, S-1 | 1–3 | 22 | 28 | 14 | 14 | SC | A-2-6 | 0 | 0.21 | Clayey sand; fill material suspected |
| B-2, S-3 | 6–8 | 78 | 61 | 27 | 34 | CH | A-7-6 | 18 | 1.05 | Fat clay; LI > 1.0 indicates near-liquid state |
| B-3, S-2 | 4–6 | 12 | NP | NP | NP | SP | A-3 | 0 | — | Fine sand; non-plastic |
| B-3, S-5 | 14–16 | 55 | 44 | 21 | 23 | CL-ML | A-6 | 9 | 0.63 | Borderline; dual symbol required |
B-2, S-3 at 6–8 ft: LI = 1.05 and GI = 18 indicate very poor subgrade. G&W Engineering Bulletin EB-14 triggers mandatory ground improvement review (Chapter 17) for GI ≥ 15 under new track construction.
Context: A sample from B-4 at 12–14 ft depth on an NSR bridge approach along the Pocahontas Division (Virginia) has the following lab results:
Step 1 — Coarse or fine-grained? 62% passing No. 200 → Fine-grained.
Step 2 — Plasticity Index:
PI = LL − PL = 48 − 21 = 27%
Step 3 — A-line check (Eq. 8-8):
PI_A-line = 0.73 × (LL − 20) = 0.73 × (48 − 20) = 0.73 × 28 = 20.4%
PI = 27% > 20.4% → Above A-line
Step 4 — LL classification: LL = 48% < 50% → Low plasticity → CL (Lean Clay)
Step 5 — Liquidity Index (Eq. 8-6):
LI = (33 − 21) / 27 = 12 / 27 = 0.44
LI = 0.44 → Stiff to medium consistency.
USCS Classification: CL — Lean Clay
Step 6 — AASHTO Check: 62% passing No. 200 > 36%; LL = 48% > 40% → A-5 or A-7; PI = 27% > 10%; PI vs. (LL − 30) = 18% → PI > LL − 30 → A-7-6
GI = (62 − 35) × [0.2 + 0.005(48 − 40)] + 0.01(62 − 15)(27 − 10)
= 27 × [0.2 + 0.040] + 0.01 × 47 × 17
= 27 × 0.240 + 7.99
= 6.48 + 7.99 = 14.47 → GI = 14
Conclusion: CL / A-7-6, GI = 14. NSR Engineering Standards Manual requires ground improvement assessment for GI ≥ 12. This sample drives a Chapter 18 CBR evaluation and Chapter 17 ground improvement scope on the NSR bridge approach.
Context: Subgrade fill investigation for a new BNSF intermodal yard near Kansas City. Lab sieve results:
| Sieve | % Passing |
|---|---|
| 1 in. | 100 |
| No. 4 | 88 |
| No. 10 | 74 |
| No. 40 | 42 |
| No. 200 | 7 |
D_10 = 0.006 in.; D_30 = 0.028 in.; D_60 = 0.10 in. LL = NP; PL = NP
Step 1 — Coarse or fine? 7% passing No. 200 → Coarse-grained.
Step 2 — Gravel or sand? 12% retained on No. 4 (= 100 − 88); 81% of coarse fraction is sand. → Sand (S)
Step 3 — Fines classification: 7% fines — borderline 5–12% → dual symbol required. Fines are NP → M suffix.
Step 4 — C_u and C_c (Eqs. 4-2, 4-3):
C_u = D_60 / D_10 = 2.5 / 0.15 = 16.7 ≥ 6 ✓
C_c = (D_30)² / (D_10 × D_60) = (0.71)² / (0.15 × 2.5)
= 0.504 / 0.375 = 1.34; 1 ≤ 1.34 ≤ 3 ✓
Meets SW criteria → SW-SM (Well-Graded Sand with Silt)
AASHTO: 7% pass No. 200 ≤ 35%; NP → A-1-b, GI = 0
Conclusion: SW-SM / A-1-b, GI = 0. Excellent subgrade material. BNSF Engineering Instructions rate this as acceptable for intermodal yard subgrade without ground improvement, subject to proof-roll acceptance during construction (Chapter 15).
Context: We are evaluating a rock cut on CPKC's Mountain Subdivision in British Columbia. NQ core (1.875-in. diameter) was recovered from a 10-ft run. Core log data:
Step 1 — R₁ (UCS = 14,500 psi): UCS = 14,500 psi → Rating = 7 Step 2 — R₂ (RQD = 68%): → Rating = 13 Step 3 — R₃ (spacing = 6 in. = 0.5 ft): 2–8 in. spacing → Rating = 10 Step 4 — R₄ (slightly rough, < 0.04-in. separation, slightly weathered): → Rating = 20 Step 5 — R₅ (damp, no free water): → Rating = 10 Step 6 — R₆ (moderately unfavorable): → Adjustment = −5
RMR = 7 + 13 + 10 + 20 + 10 + (−5) = 55
Rock Class III — Fair Rock. Per CPKC Engineering Track Standards and CN Engineering Standards (which CPKC inherited from the CN/KCS merger integration), Class III rock in a cut slope requires a kinematic stability analysis (Chapter 13) and pattern rock bolting consideration. Blasting disturbance factor D = 0.7 for production blasting; this reduces effective RMR and should be considered in the Hoek-Brown analysis.
Reference graphics
Checklist · Part V · Subsurface Exploration
Field (During Drilling and Sampling)
Laboratory
Question 4-1 A soil sample from a CSXT embankment foundation has LL = 56%, PL = 24%, and 71% passing the No. 200 sieve. Natural water content is 41%. Classify the soil by (a) USCS, (b) AASHTO with GI, and (c) calculate the Liquidity Index and interpret the consistency.
Answer 4-1: (a) > 50% pass No. 200 → fine-grained. PI = 56 − 24 = 32%. A-line at LL = 56: PI_A = 0.73 × (56 − 20) = 26.3%. PI = 32% > 26.3% and LL > 50 → CH (Fat Clay). (b) F = 71% > 36%; LL = 56% > 40%; PI = 32% > 10%; PI vs. LL − 30 = 26% → PI > LL − 30 → A-7-6. GI = (71 − 35) × [0.2 + 0.005(56 − 40)] + 0.01(71 − 15)(32 − 10) = 36 × [0.2 + 0.080] + 0.01 × 56 × 22 = 36 × 0.280 + 12.32 = 10.08 + 12.32 = GI = 22 → report as 20 (maximum value) (c) LI = (41 − 24)/32 = 17/32 = 0.53 — Medium consistency (stiff to medium). Despite being CH (high plasticity), the soil is not in an unstable state; however, GI = 20 triggers mandatory ground improvement assessment per CSXT Engineering Standards for any embankment load exceeding 3 ft of fill.
Question 4-2 Sieve analysis on an UPRR subgrade sample yields: D_10 = 0.003 in., D_30 = 0.019 in., D_60 = 0.090 in. Fines content = 9%. LL = NP. Calculate C_u and C_c and assign the USCS dual symbol.
Answer 4-2: C_u = 0.090 / 0.003 = 30.0 ≥ 6 ✓ C_c = (0.019)² / (0.003 × 0.090) = 0.000361 / 0.000270 = 1.34; 1 ≤ 1.34 ≤ 3 ✓ Meets SW criteria; fines 5–12% → dual symbol required; fines NP → M suffix → SW-SM (Well-Graded Sand with Silt). UPRR Engineering Instruction Manual accepts SW-SM as a suitable subgrade material provided density is verified during construction (Chapter 15).
Question 4-3 A VST and Atterberg limit test on a BNSF soft-ground sample yield s_u = 0.22 tsf and PI = 48%. (a) Compute the Bjerrum-corrected s_u and (b) determine the Activity if the clay fraction (< 0.002 mm) = 35%.
Answer 4-3: (a) At PI = 48%, interpolate Bjerrum μ: between 40% (μ = 0.85) and 60% (μ = 0.75) → μ = 0.75 + (60 − 48)/(60 − 40) × (0.85 − 0.75) = 0.75 + 0.60 × 0.10 = 0.75 + 0.06 = μ = 0.81 s_u (design) = 0.81 × 0.22 = 0.178 tsf = 356 psf (b) A = PI / clay fraction = 48 / 35 = 1.37 → Active clay (montmorillonite/smectite dominant). A > 1.25 triggers swell testing per BNSF Engineering Instructions. Both the corrected s_u and swell data must be included in the Appendix E geotechnical report.
Question 4-4 A 10-ft rock core run from an Amtrak NEC tunnel feasibility study in Baltimore yields: RQD = 74%; UCS = 22,000 psi; average joint spacing = 1.5 ft; slightly rough surfaces, no infill, unweathered; dry borehole; favorable orientation. Calculate RMR and classify the rock mass.
Answer 4-4: R₁: UCS = 22,000 psi → 12 R₂: RQD = 74% → 13 R₃: Spacing = 1.5 ft (18 in.; 8–24 in. range) → 15 R₄: Slightly rough, no infill, unweathered → 25 R₅: Dry → 15 R₆: Favorable orientation → 0
RMR = 12 + 13 + 15 + 25 + 15 + 0 = 80 — Class II, Good Rock. Amtrak Engineering Standards require RMR ≥ 60 for unsupported spans in tunnel design; this rock marginally satisfies the criterion and warrants a Q-system check before finalizing tunnel support recommendations.
Question 4-5 A CN subgrade sample in Manitoba (latitude 50°N) has 18% of particles finer than 0.02 mm and USCS classification ML. What frost susceptibility class applies and what is the practical implication for CN track design?
Answer 4-5: ML soils with 18% finer than 0.02 mm → FS-3 (Moderately to Highly Frost-Susceptible). CN Engineering Standards for projects north of 45°N require: (1) frost susceptibility documented in the geotechnical data report; (2) freezing degree-day analysis for the site; (3) design of subballast layer thickness sufficient to prevent frost heave in the track structure. For FS-3 soils, CN Engineering Standards typically require a minimum 30 in. of non-frost-susceptible (FS-0) granular subballast above the natural subgrade, but the required thickness must be confirmed by a site-specific freeze-depth calculation using the modified Berggren equation (beyond this chapter's scope). Track geometry monitoring (Chapter 15) is required through the first three freeze-thaw cycles after construction.
Field case studies by Burt G. Look, from Earthworks: Theory to Practice – Design and Construction (CRC Press/Balkema, 2023), chosen for this chapter’s topics. Each is summarized from the book with its key figures and a closing note on railroad application added by the authors of this manual. Credit for the case material belongs to Look; see item S13 under Supplemental Sources.
Related section: 8.2 Grain-Size Analysis
On a cut-to-fill earthworks job, rocks up to 24 in were visible and many particles exceeded 10 in, yet four of five grading certificates gave 6 in as the maximum size. Look calls this survivorship bias: the large pieces are left behind when the sample is taken, so they never appear in the result. Visual observation should always be part of the assessment.
Averaged gradings before and after compaction with two 19-ton vibrating rollers were similar to each other but clearly different from the pre-compaction gradings, because rolling breaks the material down. A specification limiting fines to 7% passing the No. 200 sieve would pass this material before compaction and fail it after. Since performance depends on the compacted state there is a case for post-compaction testing; since roller type and size change the result there is a case for pre-compaction testing. Either way, the specification has to say which.
For railroad work: the same question arises for subballast and granular fill acceptance. State in the special provision whether gradation is tested at the source, on the stockpile, or after placement and compaction.
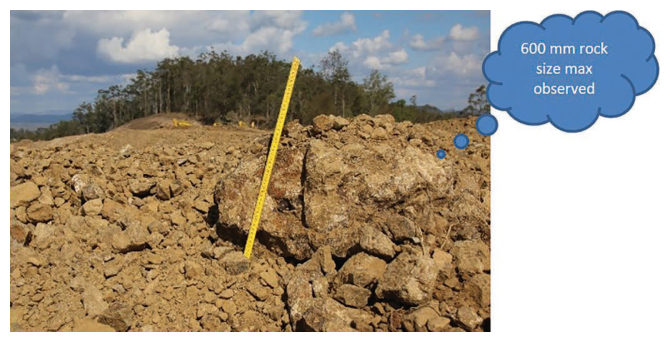
Source: Look, B. G. (2023). Earthworks: Theory to Practice – Design and Construction. CRC Press/Balkema. Case study §4.6, pp. 114. Summarized and paraphrased; figures reproduced for internal reference. Full reference under Supplemental Sources.
Related section: 8.2 Grain-Size Analysis
Four stockpile samples of extremely to slightly weathered sandstone/siltstone all reported 100% passing 1½ in., yet rocks up to 12 in were visible in the pile. After rolling, 24 post-compaction gradings gave a maximum particle size under 3 in for both roller types, while the embankment surface still showed 12 in. pieces. The “increase” in coarse fraction after compaction is an artefact of the biased pre-compaction samples. Fines rose only slightly, from 10% to about 11%, although rolling visibly broke down the large weathered particles.
Look’s conclusion is that the industry places misplaced confidence in test certificates as proof that a material specification has been met.
Table 8-LK1. Average gradings of XW–SW sandstone/siltstone, % passing (after Look 2023, Table 5.7)
| Sieve | Pre-compaction (n = 4) | Smooth drum (n = 12) | Padfoot (n = 12) |
|---|---|---|---|
| 3 in. | 100.0 | 100.0 | 100.0 |
| 1½ in. | 100.0 | 82.8 | 80.3 |
| ¾ in. | 75.5 | 65.4 | 61.8 |
| No. 8 | 33.0 | 25.0 | 23.9 |
| No. 40 | 27.0 | 21.6 | 20.4 |
| No. 200 | 10.0 | 11.1 | 10.8 |
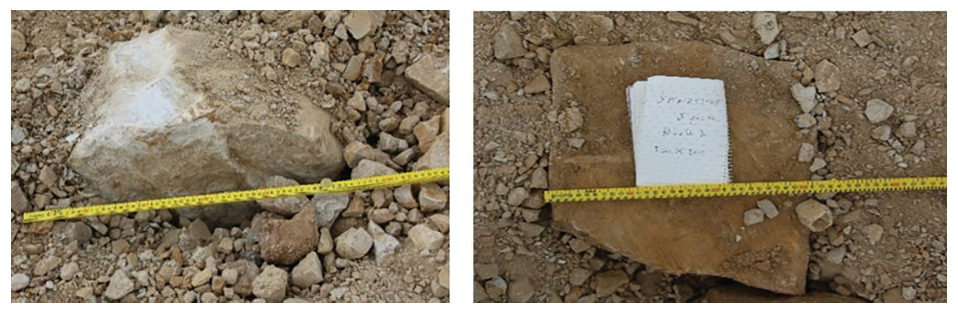
Source: Look, B. G. (2023). Earthworks: Theory to Practice – Design and Construction. CRC Press/Balkema. Case study §5.9, pp. 142–144. Summarized and paraphrased; figures reproduced for internal reference. Full reference under Supplemental Sources.
Authors: Daniel P. Colwell and Mario Ruel. This chapter was written and compiled by Daniel P. Colwell and Mario Ruel for Railway Ground Hazard Risk Management.
Technical content is drawn from the published sources below, and credit for that material belongs to their authors and publishers. Tables, equations and figures taken from a specific source are also cited where they appear.
File locations for these documents are listed under Supplemental Sources — LEVI Library.
Material in the green “Supplemental reference” boxes throughout this chapter was added from the following documents in the LEVI geotechnical library. Text is summarized or paraphrased; tables are reproduced with their original source noted; figures are reproduced from the cited document for internal reference use. Consult the original document before relying on a value for design. Blocks marked “After Selig & Waters (1994)” summarize item S12 for railroad clients; tables are condensed from the book and its figures are not reproduced. The Case Studies section summarizes case studies from item S13 by Burt G. Look; its figures are reproduced from the book for internal reference use, and the closing “For railroad work” note in each case study is added by the authors of this manual.